Broadridge trades at $263.47 per share and has stayed right on track with the overall market, gaining 8.7% over the last six months. At the same time, the S&P 500 has returned 5.4%.
Is now the time to buy BR? Find out in our full research report, it’s free.
Why Does Broadridge Spark Debate?
Processing over $10 trillion in equity and fixed income trades daily and managing proxy voting for over 800 million equity positions, Broadridge Financial Solutions (NYSE: BR) provides technology-driven solutions that power investing, governance, and communications for banks, broker-dealers, asset managers, and public companies.
Two Positive Attributes:
1. Long-Term Revenue Growth Shows Strong Momentum
A company’s long-term sales performance can indicate its overall quality. Any business can put up a good quarter or two, but many enduring ones grow for years. Luckily, Broadridge’s sales grew at a solid 8.8% compounded annual growth rate over the last five years. Its growth surpassed the average business services company and shows its offerings resonate with customers. 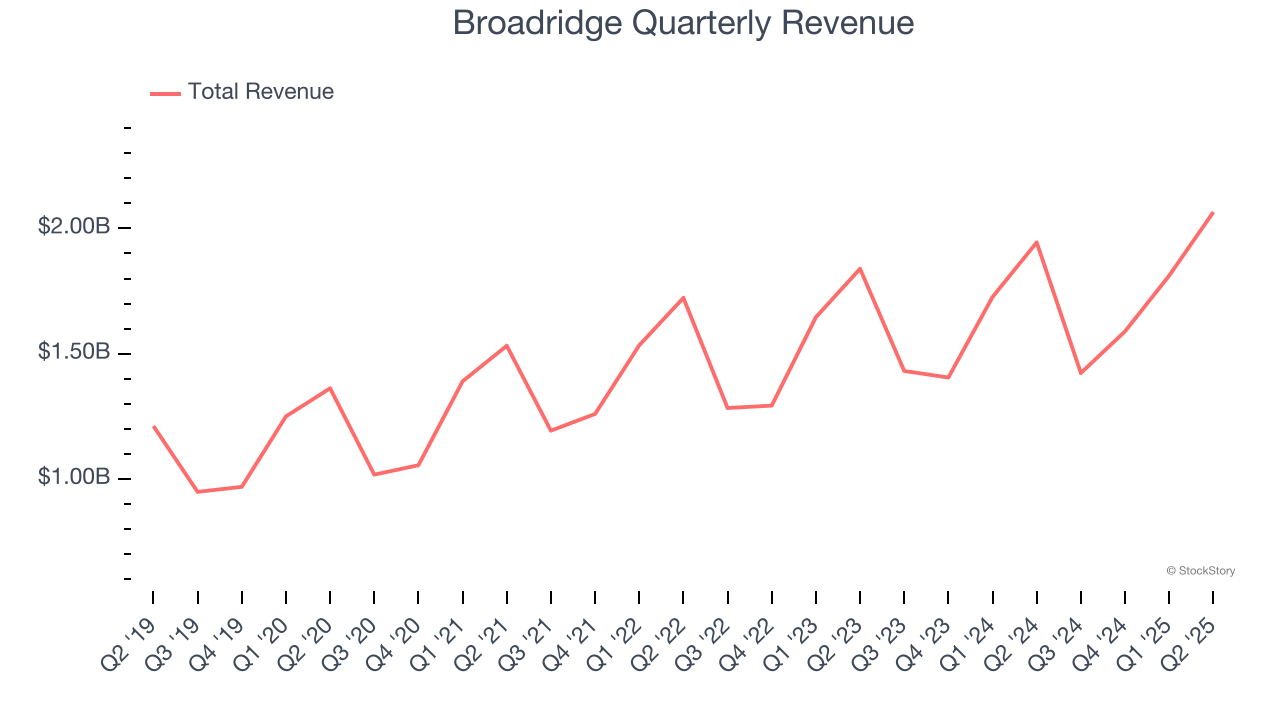
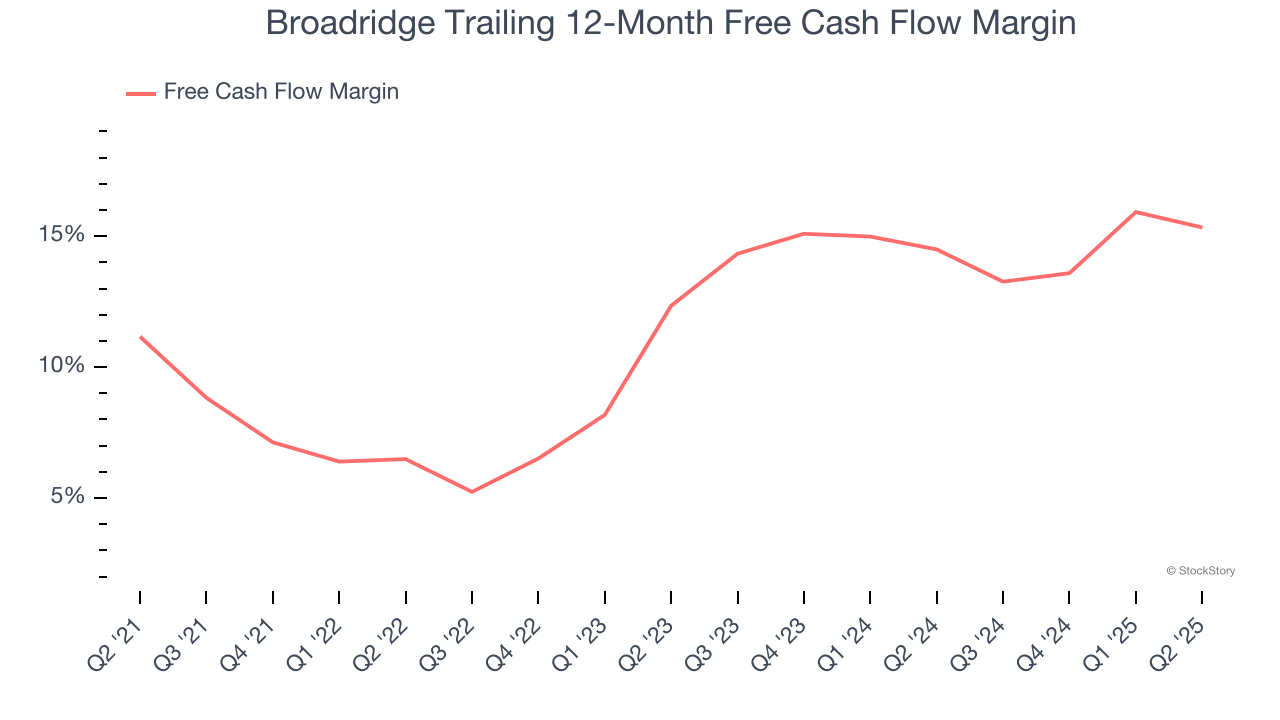
2. Increasing Free Cash Flow Margin Juices Financials
Free cash flow isn't a prominently featured metric in company financials and earnings releases, but we think it's telling because it accounts for all operating and capital expenses, making it tough to manipulate. Cash is king.
As you can see below, Broadridge’s margin expanded by 4.2 percentage points over the last five years. This shows the company is heading in the right direction, and we can see it became a less capital-intensive business because its free cash flow profitability rose more than its operating profitability. Broadridge’s free cash flow margin for the trailing 12 months was 15.3%.
One Reason to be Careful:
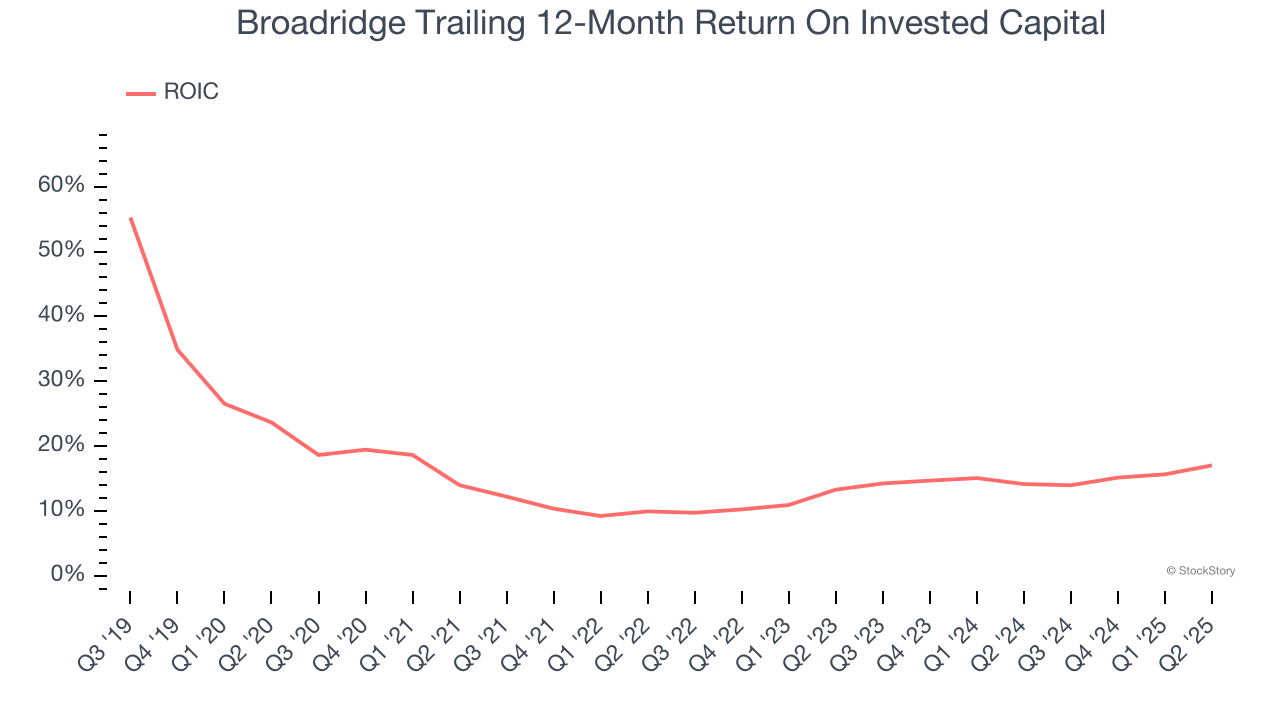
Previous Growth Initiatives Haven’t Impressed
Growth gives us insight into a company’s long-term potential, but how capital-efficient was that growth? A company’s ROIC explains this by showing how much operating profit it makes compared to the money it has raised (debt and equity).
Although Broadridge has shown solid business quality lately, it historically did a mediocre job investing in profitable growth initiatives. Its five-year average ROIC was 13.7%, somewhat low compared to the best business services companies that consistently pump out 25%+.
Final Judgment
Broadridge has huge potential even though it has some open questions, but at $263.47 per share (or 28.6× forward P/E), is now the right time to buy the stock? See for yourself in our comprehensive research report, it’s free.
Stocks We Like Even More Than Broadridge
Donald Trump’s April 2025 "Liberation Day" tariffs sent markets into a tailspin, but stocks have since rebounded strongly, proving that knee-jerk reactions often create the best buying opportunities.
The smart money is already positioning for the next leg up. Don’t miss out on the recovery - check out our Top 9 Market-Beating Stocks. This is a curated list of our High Quality stocks that have generated a market-beating return of 183% over the last five years (as of March 31st 2025).
Stocks that made our list in 2020 include now familiar names such as Nvidia (+1,545% between March 2020 and March 2025) as well as under-the-radar businesses like the once-small-cap company Exlservice (+354% five-year return). Find your next big winner with StockStory today.
StockStory is growing and hiring equity analyst and marketing roles. Are you a 0 to 1 builder passionate about the markets and AI? See the open roles here.


