The end of the earnings season is always a good time to take a step back and see who shined (and who not so much). Let’s take a look at how traditional fast food stocks fared in Q2, starting with Starbucks (NASDAQ: SBUX).
Traditional fast-food restaurants are renowned for their speed and convenience, boasting menus filled with familiar and budget-friendly items. Their reputations for on-the-go consumption make them favored destinations for individuals and families needing a quick meal. This class of restaurants, however, is fighting the perception that their meals are unhealthy and made with inferior ingredients, a battle that's especially relevant today given the consumers increasing focus on health and wellness.
The 14 traditional fast food stocks we track reported a mixed Q2. As a group, revenues were in line with analysts’ consensus estimates.
In light of this news, share prices of the companies have held steady. On average, they are relatively unchanged since the latest earnings results.
Starbucks (NASDAQ: SBUX)
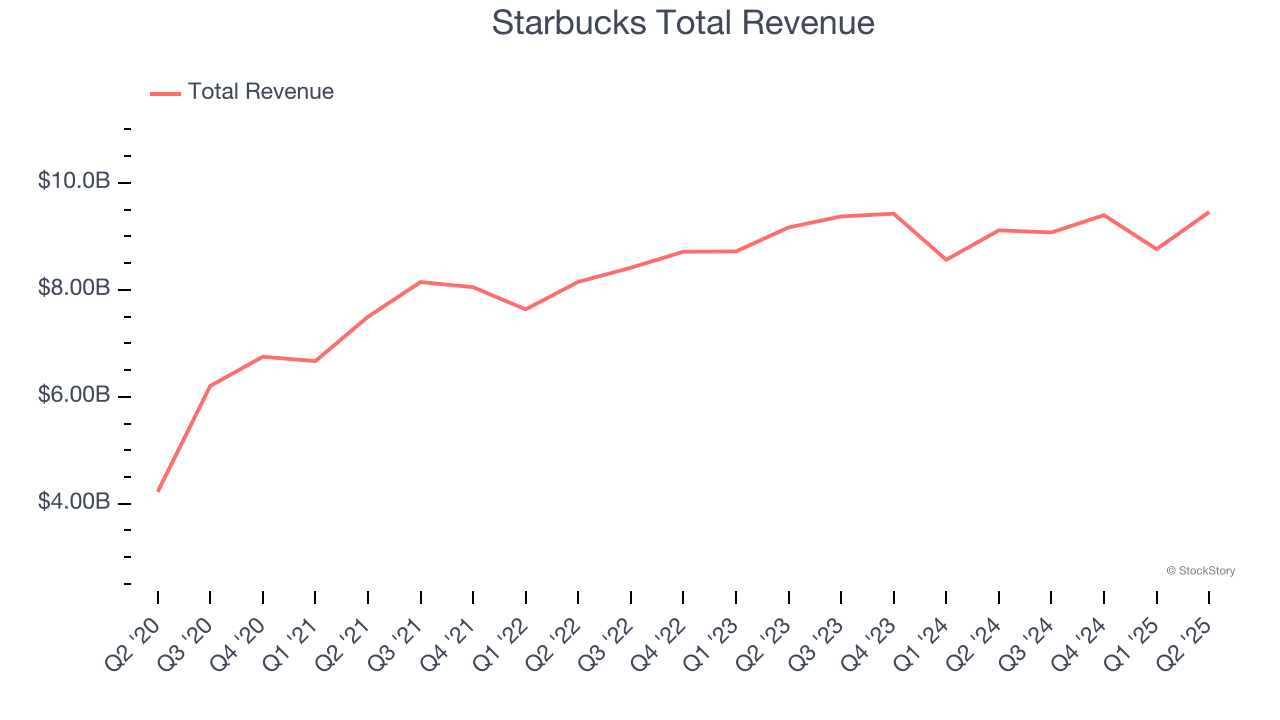
Started by three friends in Seattle’s historic Pike Place Market, Starbucks (NASDAQ: SBUX) is a globally-renowned coffeehouse chain that offers a wide selection of high-quality coffee, beverages, and food items.
Starbucks reported revenues of $9.46 billion, up 3.8% year on year. This print exceeded analysts’ expectations by 1.7%. Despite the top-line beat, it was still a slower quarter for the company with a significant miss of analysts’ EBITDA and EPS estimates.
Unsurprisingly, the stock is down 2% since reporting and currently trades at $91.11.
Read our full report on Starbucks here, it’s free.
Best Q2: Dutch Bros (NYSE: BROS)
Started in 1992 by two brothers as a single pushcart, Dutch Bros (NYSE: BROS) is a dynamic coffee chain that’s captured the hearts of coffee enthusiasts across the United States.
Dutch Bros reported revenues of $415.8 million, up 28% year on year, outperforming analysts’ expectations by 3.1%. The business had a stunning quarter with a solid beat of analysts’ EBITDA and same-store sales estimates.
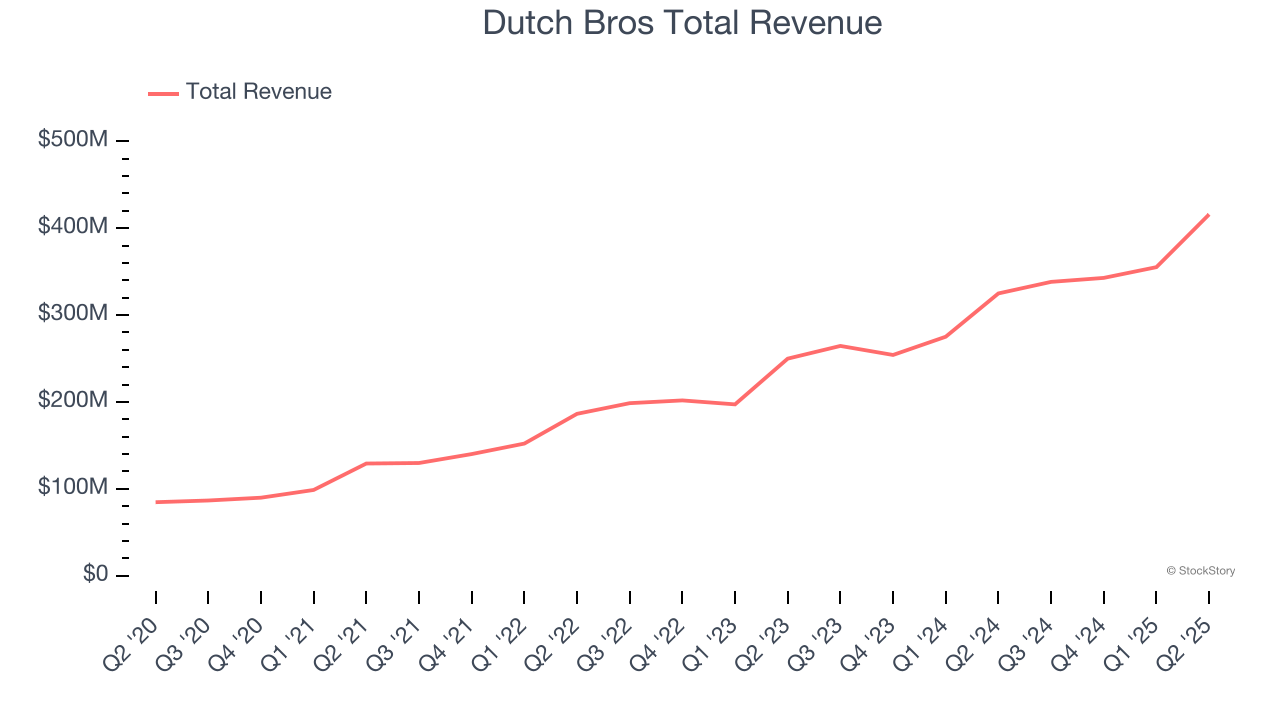
Dutch Bros scored the biggest analyst estimates beat and fastest revenue growth among its peers. The market seems happy with the results as the stock is up 10% since reporting. It currently trades at $63.55.
Is now the time to buy Dutch Bros? Access our full analysis of the earnings results here, it’s free.
Weakest Q2: Jack in the Box (NASDAQ: JACK)
Delighting customers since its inception in 1951, Jack in the Box (NASDAQ: JACK) is a distinctive fast-food chain known for its bold flavors, innovative menu items, and quirky marketing.
Jack in the Box reported revenues of $333 million, down 9.8% year on year, falling short of analysts’ expectations by 2.1%. It was a softer quarter as it posted a miss of analysts’ EBITDA estimates and a miss of analysts’ same-store sales estimates.
The stock is flat since the results and currently trades at $19.02.
Read our full analysis of Jack in the Box’s results here.
Restaurant Brands (NYSE: QSR)
Formed through a strategic merger, Restaurant Brands International (NYSE: QSR) is a multinational corporation that owns three iconic fast-food chains: Burger King, Tim Hortons, and Popeyes.
Restaurant Brands reported revenues of $2.41 billion, up 15.9% year on year. This result topped analysts’ expectations by 2.9%. It was a strong quarter as it also logged same-store sales in line with analysts’ estimates.
The stock is down 2.8% since reporting and currently trades at $66.66.
Read our full, actionable report on Restaurant Brands here, it’s free.
Wendy's (NASDAQ: WEN)
Founded by Dave Thomas in 1969, Wendy’s (NASDAQ: WEN) is a renowned fast-food chain known for its fresh, never-frozen beef burgers, flavorful menu options, and commitment to quality.
Wendy's reported revenues of $560.9 million, down 1.7% year on year. This print surpassed analysts’ expectations by 0.6%. Taking a step back, it was a mixed quarter as it also logged an impressive beat of analysts’ EBITDA estimates but full-year EBITDA guidance missing analysts’ expectations.
The stock is up 6% since reporting and currently trades at $10.57.
Read our full, actionable report on Wendy's here, it’s free.
Market Update
Thanks to the Fed’s rate hikes in 2022 and 2023, inflation has been on a steady path downward, easing back toward that 2% sweet spot. Fortunately (miraculously to some), all this tightening didn’t send the economy tumbling into a recession, so here we are, cautiously celebrating a soft landing. The cherry on top? Recent rate cuts (half a point in September 2024, a quarter in November) have propped up markets, especially after Trump’s November win lit a fire under major indices and sent them to all-time highs. However, there’s still plenty to ponder — tariffs, corporate tax cuts, and what 2025 might hold for the economy.
Want to invest in winners with rock-solid fundamentals? Check out our Strong Momentum Stocks and add them to your watchlist. These companies are poised for growth regardless of the political or macroeconomic climate.
StockStory is growing and hiring equity analyst and marketing roles. Are you a 0 to 1 builder passionate about the markets and AI? See the open roles here.