
Since February 2025, Roku has been in a holding pattern, posting a small loss of 0.8% while floating around $90.54. The stock also fell short of the S&P 500’s 6.4% gain during that period.
Is there a buying opportunity in Roku, or does it present a risk to your portfolio? Get the full stock story straight from our expert analysts, it’s free.
Why Is Roku Not Exciting?
We're sitting this one out for now. Here are three reasons why you should be careful with ROKU and a stock we'd rather own.
1. Customer Spending Stalls, Engagement Falling?
Average revenue per user (ARPU) is a critical metric to track because it measures how much the average user spends. ARPU is also a key indicator of how valuable its users are (and can be over time).
Roku’s ARPU has been roughly flat over the last two years. This isn’t great, but the increase in total hours streamed is more relevant for assessing long-term business potential. We’ll monitor the situation closely; if Roku tries boosting ARPU by taking a more aggressive approach to monetization, it’s unclear whether users can continue growing at the current pace. 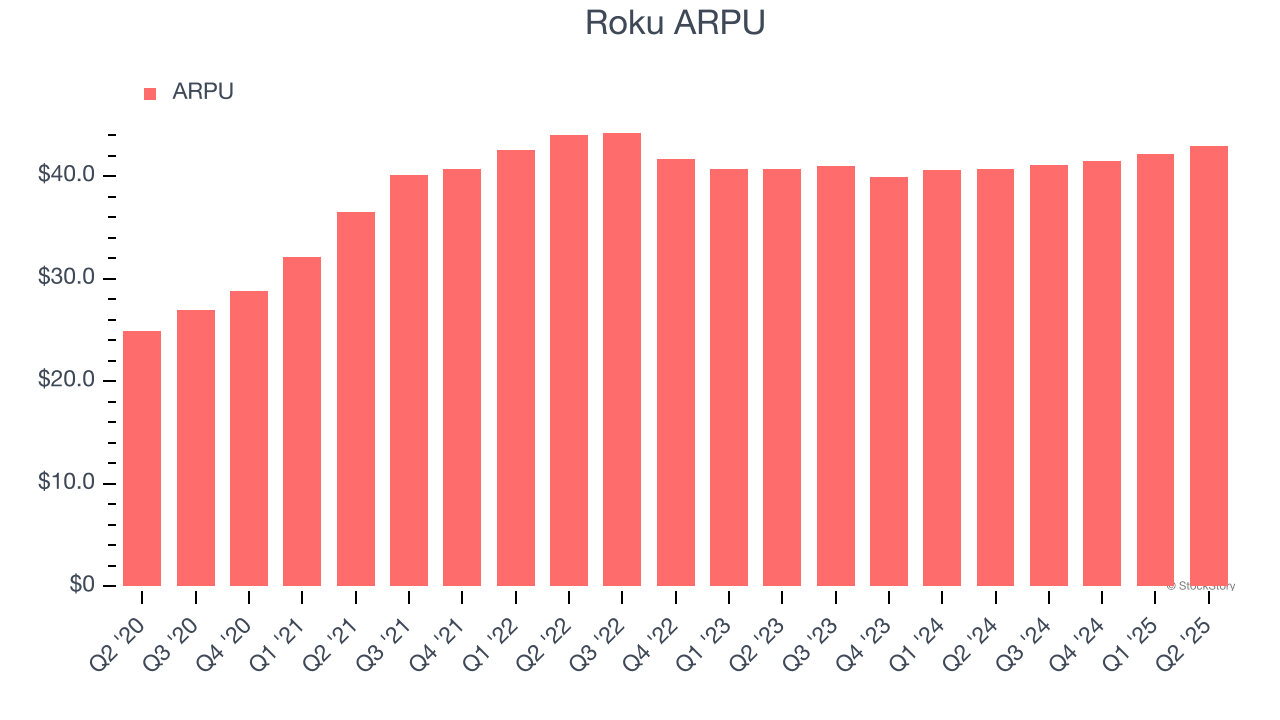
2. Low Gross Margin Reveals Weak Structural Profitability
For internet subscription businesses like Roku, gross profit tells us how much money the company gets to keep after covering the base cost of its products and services, which typically include customer service, data center and infrastructure expenses, royalties, and other content-related costs if the company’s offerings include features such as video or music.
Roku’s gross margin is below the broader consumer internet industry, giving it less room to hire engineering talent that can develop new products and services. As you can see below, it averaged a 44.5% gross margin over the last two years. That means Roku paid its providers a lot of money ($55.47 for every $100 in revenue) to run its business. 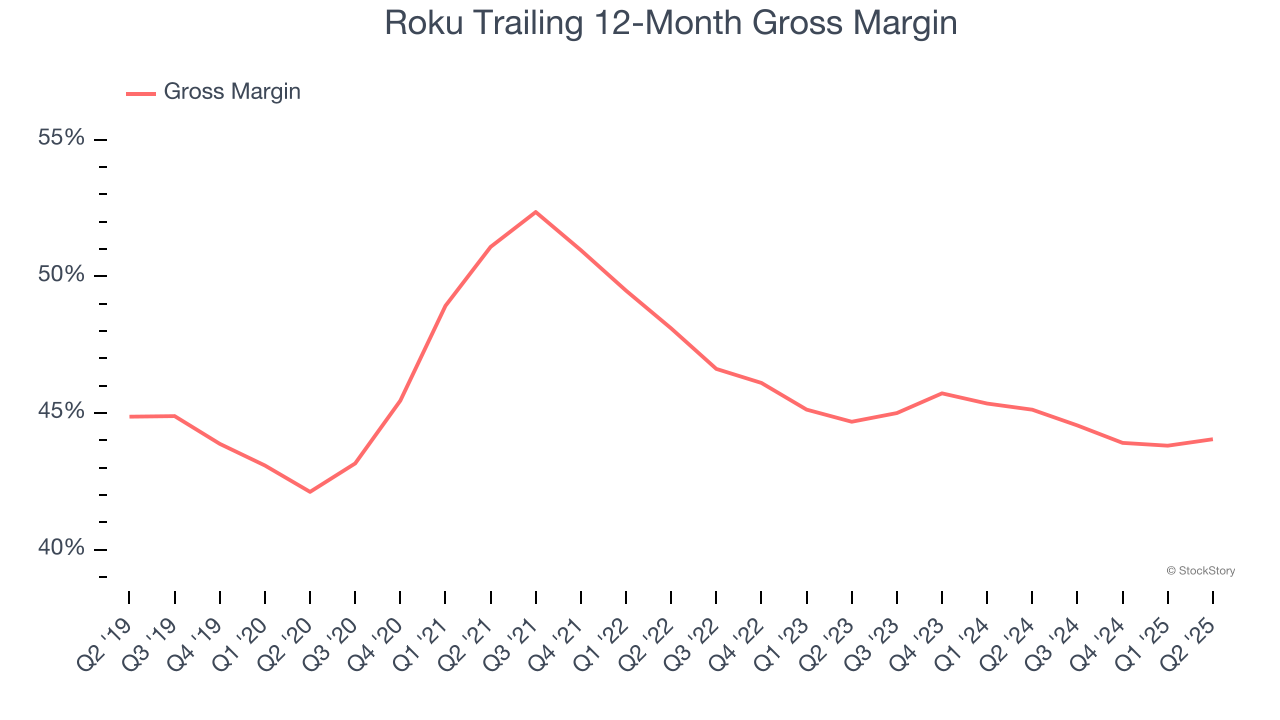
3. EPS Barely Improving
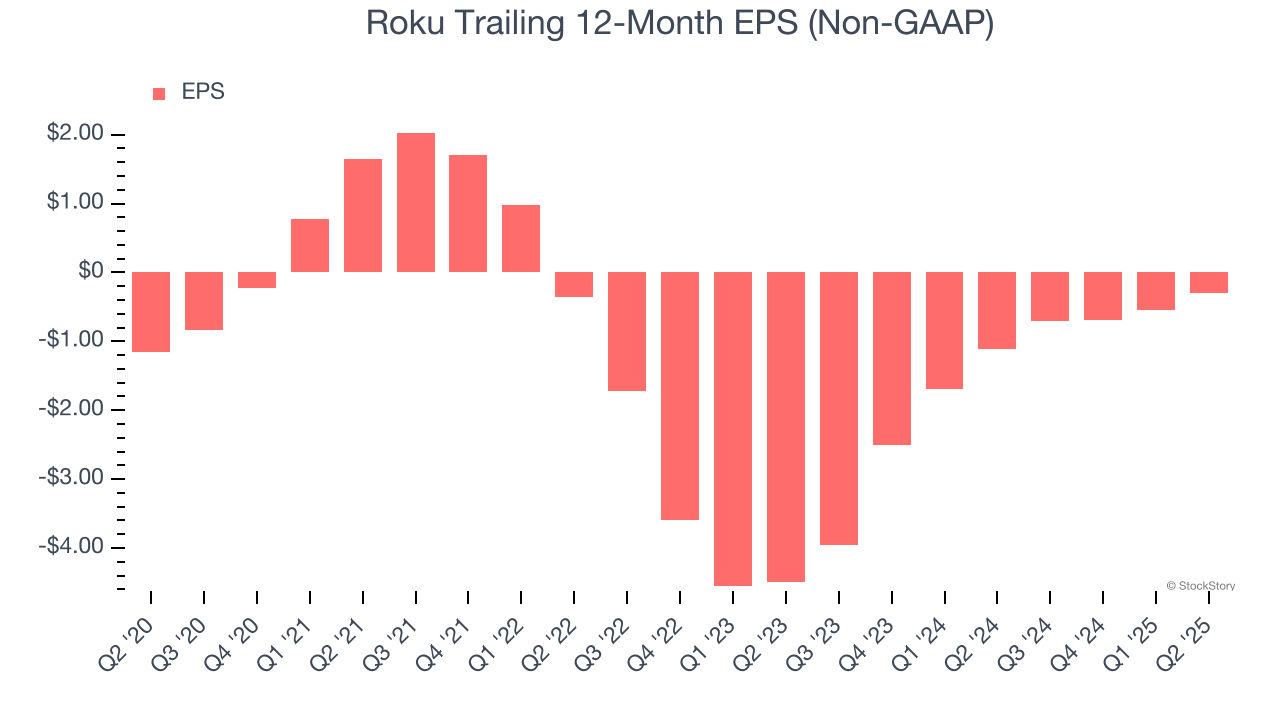
We track the change in earnings per share (EPS) because it highlights whether a company’s growth is profitable.
Although Roku’s full-year earnings are still negative, it reduced its losses and improved its EPS by 6.5% annually over the last three years. The next few quarters will be critical for assessing its long-term profitability.
Final Judgment
Roku’s business quality ultimately falls short of our standards. With its shares lagging the market recently, the stock trades at 32× forward EV/EBITDA (or $90.54 per share). This multiple tells us a lot of good news is priced in - we think there are better stocks to buy right now. Let us point you toward the most entrenched endpoint security platform on the market.
Stocks We Like More Than Roku
Donald Trump’s April 2025 "Liberation Day" tariffs sent markets into a tailspin, but stocks have since rebounded strongly, proving that knee-jerk reactions often create the best buying opportunities.
The smart money is already positioning for the next leg up. Don’t miss out on the recovery - check out our Top 9 Market-Beating Stocks. This is a curated list of our High Quality stocks that have generated a market-beating return of 183% over the last five years (as of March 31st 2025).
Stocks that made our list in 2020 include now familiar names such as Nvidia (+1,545% between March 2020 and March 2025) as well as under-the-radar businesses like the once-micro-cap company Kadant (+351% five-year return). Find your next big winner with StockStory today.
StockStory is growing and hiring equity analyst and marketing roles. Are you a 0 to 1 builder passionate about the markets and AI? See the open roles here.


