Since February 2025, Fifth Third Bancorp has been in a holding pattern, posting a small return of 3.3% while floating around $44.25.
Is there a buying opportunity in Fifth Third Bancorp, or does it present a risk to your portfolio? Dive into our full research report to see our analyst team’s opinion, it’s free.
Why Is Fifth Third Bancorp Not Exciting?
We're swiping left on Fifth Third Bancorp for now. Here are three reasons you should be careful with FITB and a stock we'd rather own.
1. Net Interest Income Points to Soft Demand
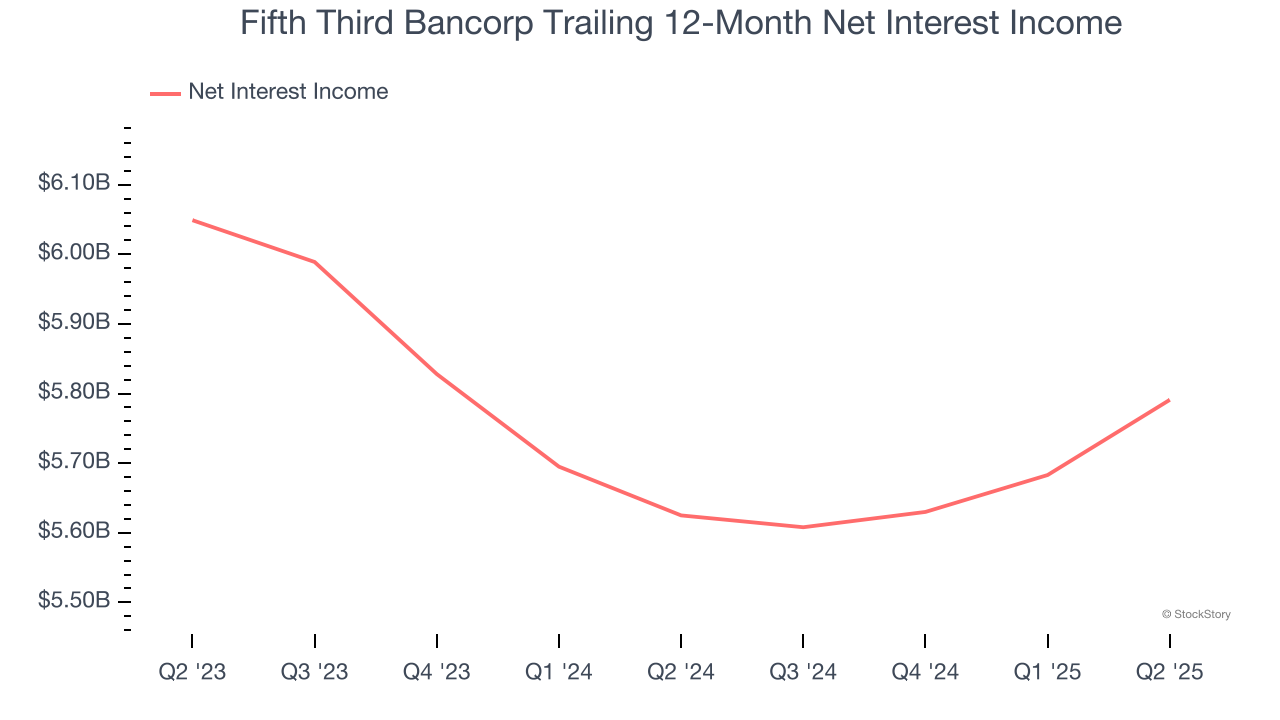
Our experience and research show the market cares primarily about a bank’s net interest income growth as one-time fees are considered a lower-quality and non-recurring revenue source.
Fifth Third Bancorp’s net interest income has grown at a 3.8% annualized rate over the last five years, worse than the broader banking industry. Its growth was driven by both an increase in its outstanding loans and net interest margin, which represents how much a bank earns in relation to its outstanding loan book.
2. Low Net Interest Margin Reveals Weak Loan Book Profitability
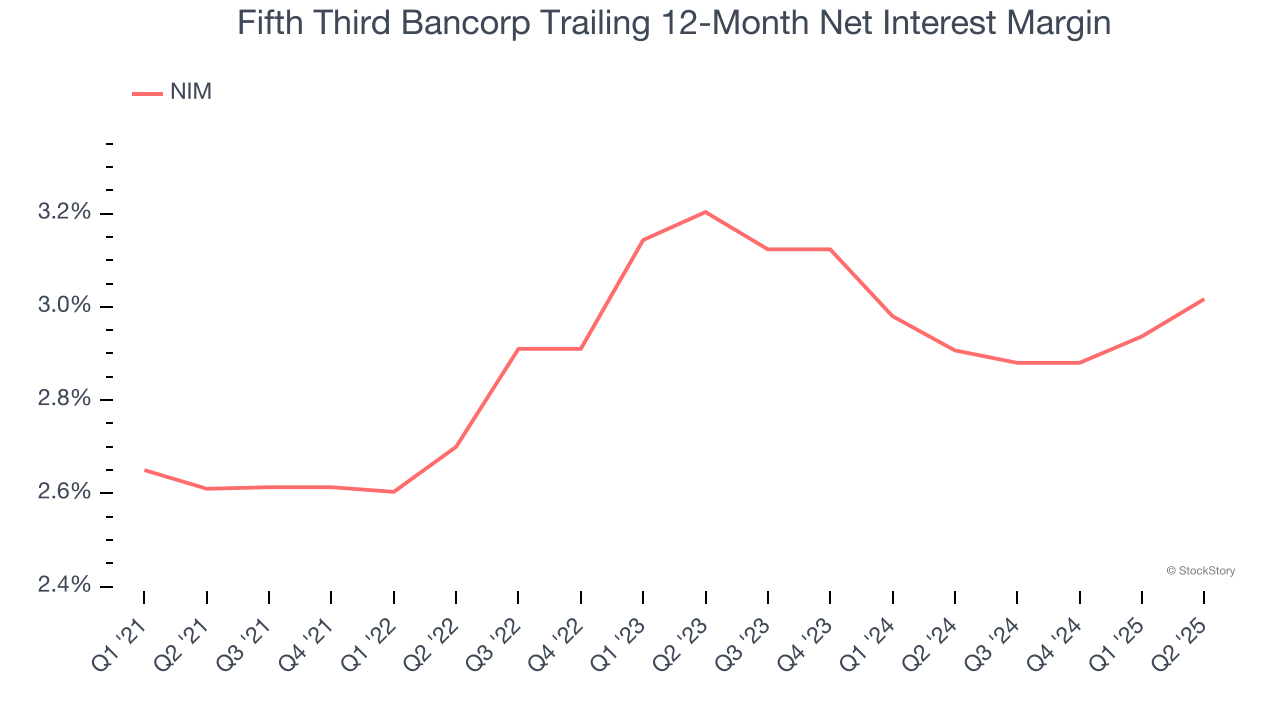
Net interest margin (NIM) represents how much a bank earns in relation to its outstanding loans. It's one of the most important metrics to track because it shows how a bank's loans are performing and whether it has the ability to command higher premiums for its services.
Over the past two years, we can see that Fifth Third Bancorp’s net interest margin averaged a weak 3%. This metric is well below other banks, signaling its loans aren’t very profitable.
3. Growing TBVPS Reflects Strong Asset Base
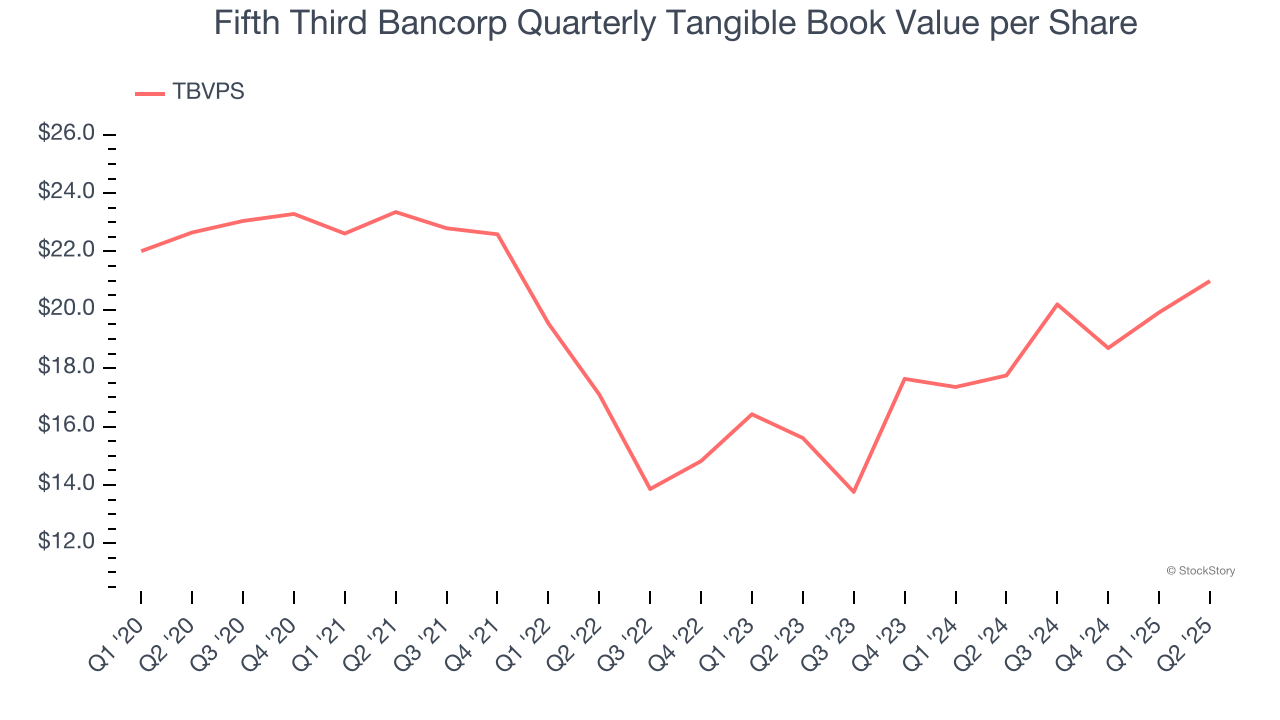
Tangible book value per share (TBVPS) serves as a key indicator of a bank’s financial strength, representing the hard assets available to shareholders after removing intangible assets that could evaporate during financial distress.
Although Fifth Third Bancorp’s TBVPS declined at a 1.5% annual clip over the last five years. the good news is that its growth inflected positive over the past two years as TBVPS grew at an impressive 16% annual clip (from $15.61 to $20.99 per share).
Final Judgment
Fifth Third Bancorp’s business quality ultimately falls short of our standards. That said, the stock currently trades at 1.5× forward P/B (or $44.25 per share). This valuation multiple is fair, but we don’t have much faith in the company. We're pretty confident there are more exciting stocks to buy at the moment. Let us point you toward one of our top digital advertising picks.
High-Quality Stocks for All Market Conditions
When Trump unveiled his aggressive tariff plan in April 2025, markets tanked as investors feared a full-blown trade war. But those who panicked and sold missed the subsequent rebound that’s already erased most losses.
Don’t let fear keep you from great opportunities and take a look at Top 6 Stocks for this week. This is a curated list of our High Quality stocks that have generated a market-beating return of 183% over the last five years (as of March 31st 2025).
Stocks that made our list in 2020 include now familiar names such as Nvidia (+1,545% between March 2020 and March 2025) as well as under-the-radar businesses like the once-micro-cap company Kadant (+351% five-year return). Find your next big winner with StockStory today.
StockStory is growing and hiring equity analyst and marketing roles. Are you a 0 to 1 builder passionate about the markets and AI? See the open roles here.


