
Medical device company CooperCompanies (NASDAQ: COO) met Wall Street’s revenue expectations in Q2 CY2025, with sales up 5.7% year on year to $1.06 billion. On the other hand, next quarter’s revenue guidance of $1.06 billion was less impressive, coming in 2.8% below analysts’ estimates. Its non-GAAP profit of $1.10 per share was 3% above analysts’ consensus estimates.
Is now the time to buy CooperCompanies? Find out by accessing our full research report, it’s free.
CooperCompanies (COO) Q2 CY2025 Highlights:
- Revenue: $1.06 billion vs analyst estimates of $1.06 billion (5.7% year-on-year growth, in line)
- Adjusted EPS: $1.10 vs analyst estimates of $1.07 (3% beat)
- Revenue Guidance for Q3 CY2025 is $1.06 billion at the midpoint, below analyst estimates of $1.09 billion
- Management slightly raised its full-year Adjusted EPS guidance to $4.10 at the midpoint
- Operating Margin: 16.6%, down from 19.2% in the same quarter last year
- Organic Revenue rose 2% year on year vs analyst estimates of 4.9% growth (288.8 basis point miss)
- Market Capitalization: $14.7 billion
Commenting on the results, Al White, CooperCompanies' President and CEO said, "I am pleased to report that we delivered strong margins, double-digit earnings growth, and robust free cash flow reflecting the operational excellence that remains central to our growth strategy. Our revenues were below expectations but we're raising earnings guidance to reflect our operational performance and expect improving revenue in Q4 and in fiscal 2026 driven by MyDAY®. We remain confident in our strategy and ability to deliver long-term shareholder value."
Company Overview
With a history dating back to 1958 and a portfolio spanning two distinct healthcare segments, Cooper Companies (NASDAQ: COO) develops and manufactures medical devices focused on vision care through contact lenses and women's health including fertility products and services.
Revenue Growth
Examining a company’s long-term performance can provide clues about its quality. Even a bad business can shine for one or two quarters, but a top-tier one grows for years. Over the last five years, CooperCompanies grew its sales at a decent 10.6% compounded annual growth rate. Its growth was slightly above the average healthcare company and shows its offerings resonate with customers.
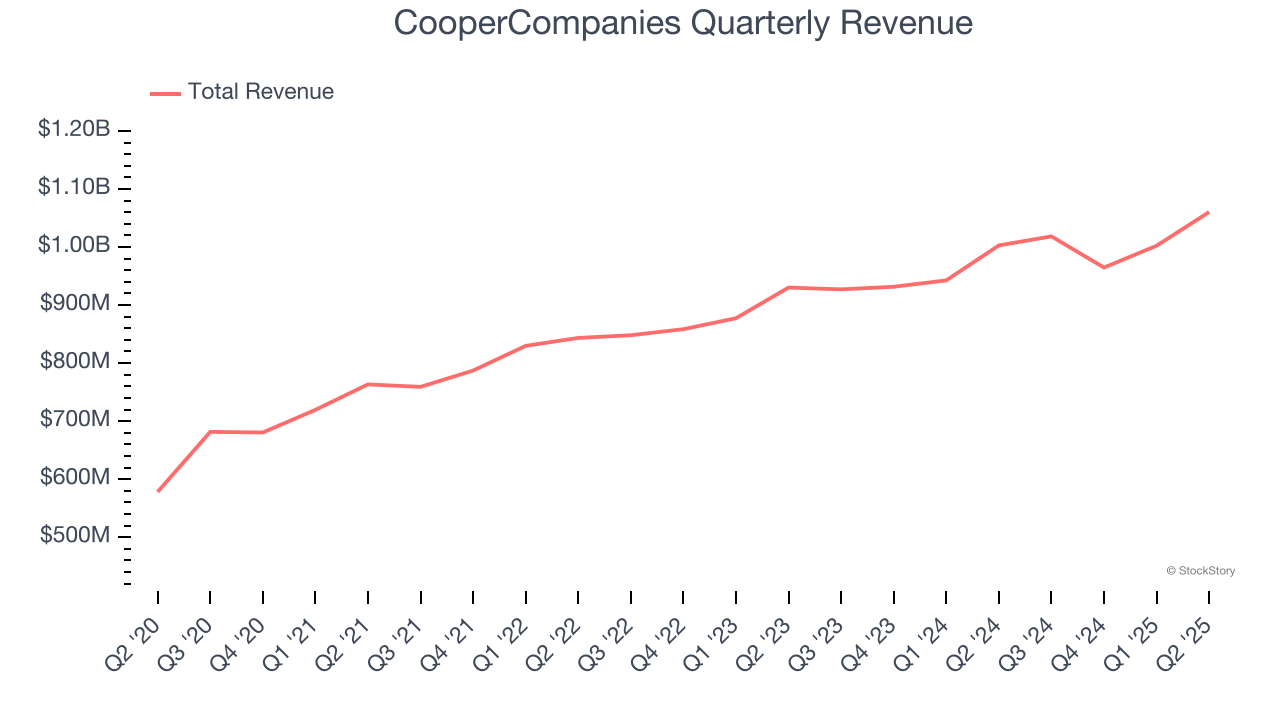
We at StockStory place the most emphasis on long-term growth, but within healthcare, a half-decade historical view may miss recent innovations or disruptive industry trends. CooperCompanies’s recent performance shows its demand has slowed as its annualized revenue growth of 7.3% over the last two years was below its five-year trend. 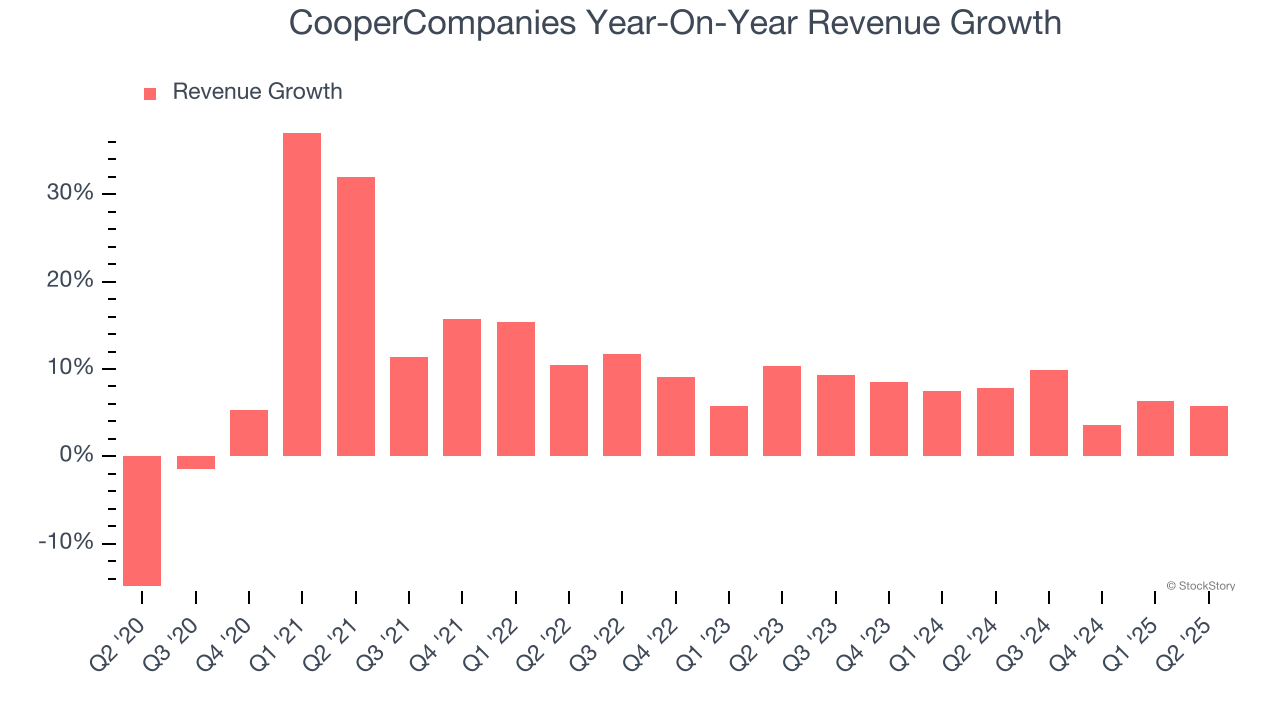
We can dig further into the company’s sales dynamics by analyzing its organic revenue, which strips out one-time events like acquisitions and currency fluctuations that don’t accurately reflect its fundamentals. Over the last two years, CooperCompanies’s organic revenue averaged 6.7% year-on-year growth. Because this number aligns with its two-year revenue growth, we can see the company’s core operations (not acquisitions and divestitures) drove most of its results. 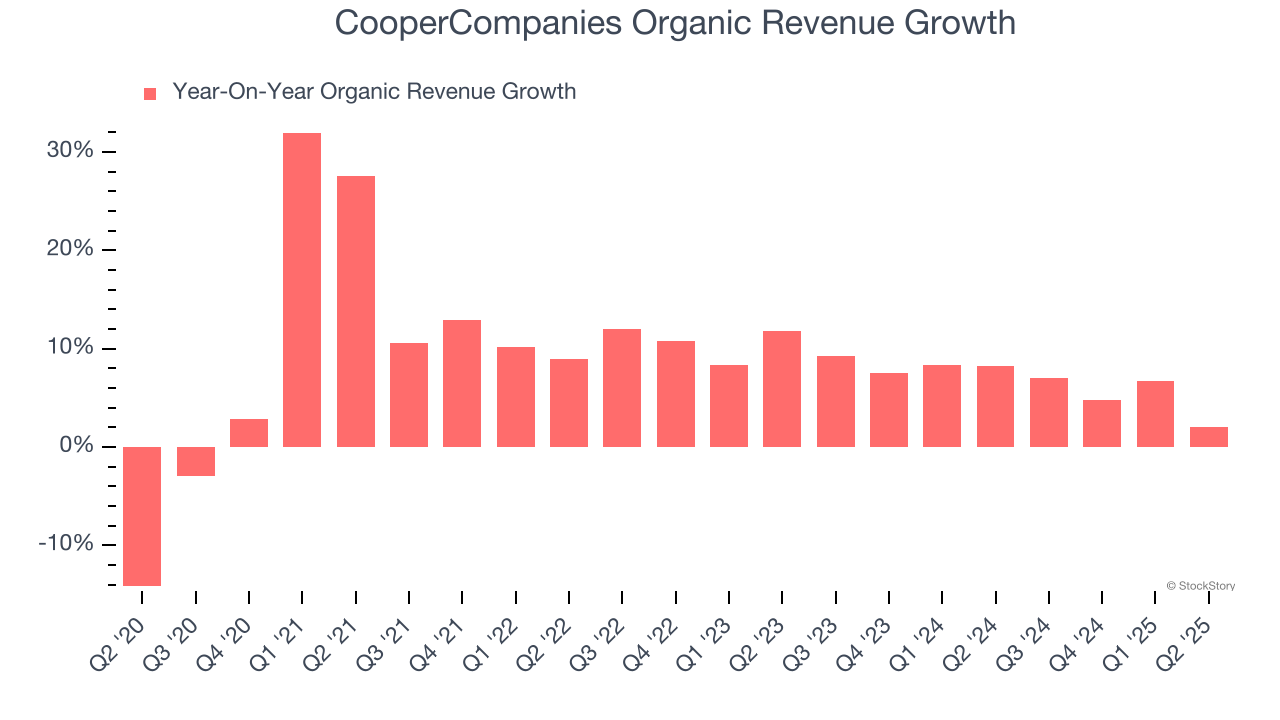
This quarter, CooperCompanies grew its revenue by 5.7% year on year, and its $1.06 billion of revenue was in line with Wall Street’s estimates. Company management is currently guiding for a 4% year-on-year increase in sales next quarter.
Looking further ahead, sell-side analysts expect revenue to grow 6.7% over the next 12 months, similar to its two-year rate. This projection is above average for the sector and indicates its newer products and services will help sustain its recent top-line performance.
Here at StockStory, we certainly understand the potential of thematic investing. Diverse winners from Microsoft (MSFT) to Alphabet (GOOG), Coca-Cola (KO) to Monster Beverage (MNST) could all have been identified as promising growth stories with a megatrend driving the growth. So, in that spirit, we’ve identified a relatively under-the-radar profitable growth stock benefiting from the rise of AI, available to you FREE via this link.
Operating Margin
CooperCompanies has managed its cost base well over the last five years. It demonstrated solid profitability for a healthcare business, producing an average operating margin of 16.6%.
Analyzing the trend in its profitability, CooperCompanies’s operating margin rose by 1.5 percentage points over the last five years, as its sales growth gave it operating leverage. This performance was mostly driven by its recent improvements as the company’s margin has increased by 4.1 percentage points on a two-year basis.
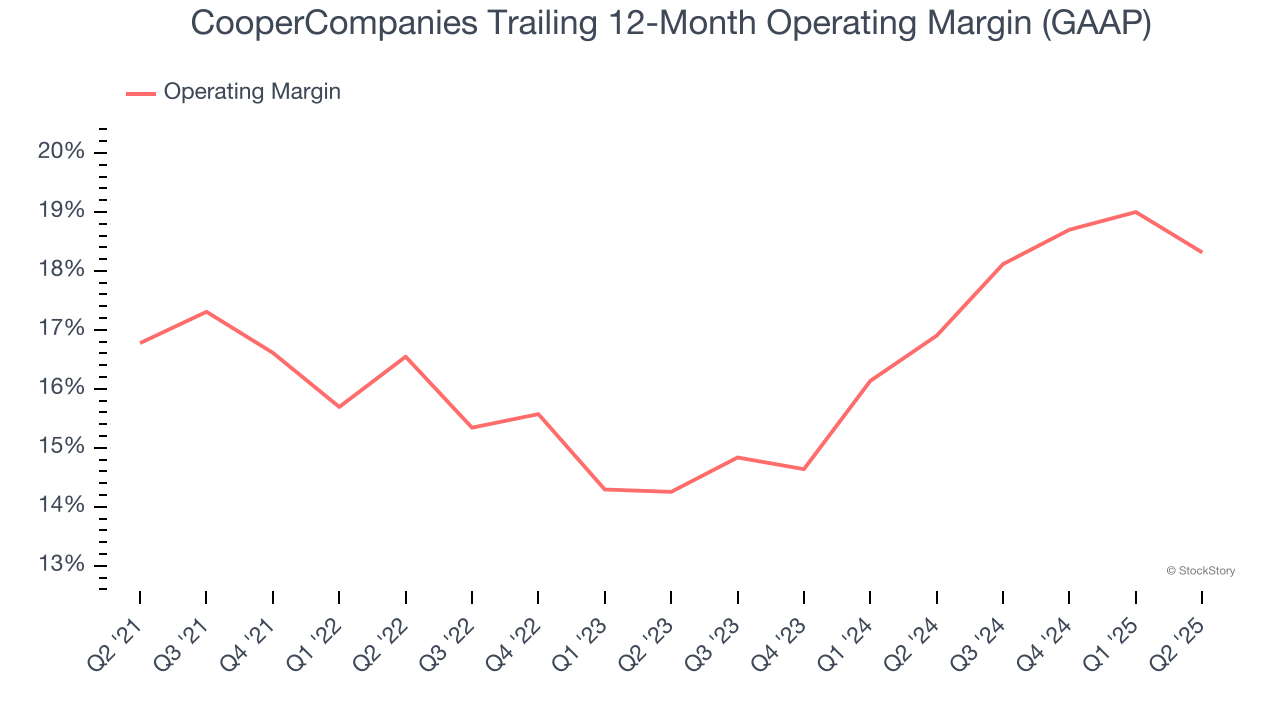
In Q2, CooperCompanies generated an operating margin profit margin of 16.6%, down 2.6 percentage points year on year. This contraction shows it was less efficient because its expenses grew faster than its revenue.
Earnings Per Share
Revenue trends explain a company’s historical growth, but the long-term change in earnings per share (EPS) points to the profitability of that growth – for example, a company could inflate its sales through excessive spending on advertising and promotions.
CooperCompanies’s remarkable 10.5% annual EPS growth over the last five years aligns with its revenue performance. This tells us its incremental sales were profitable.
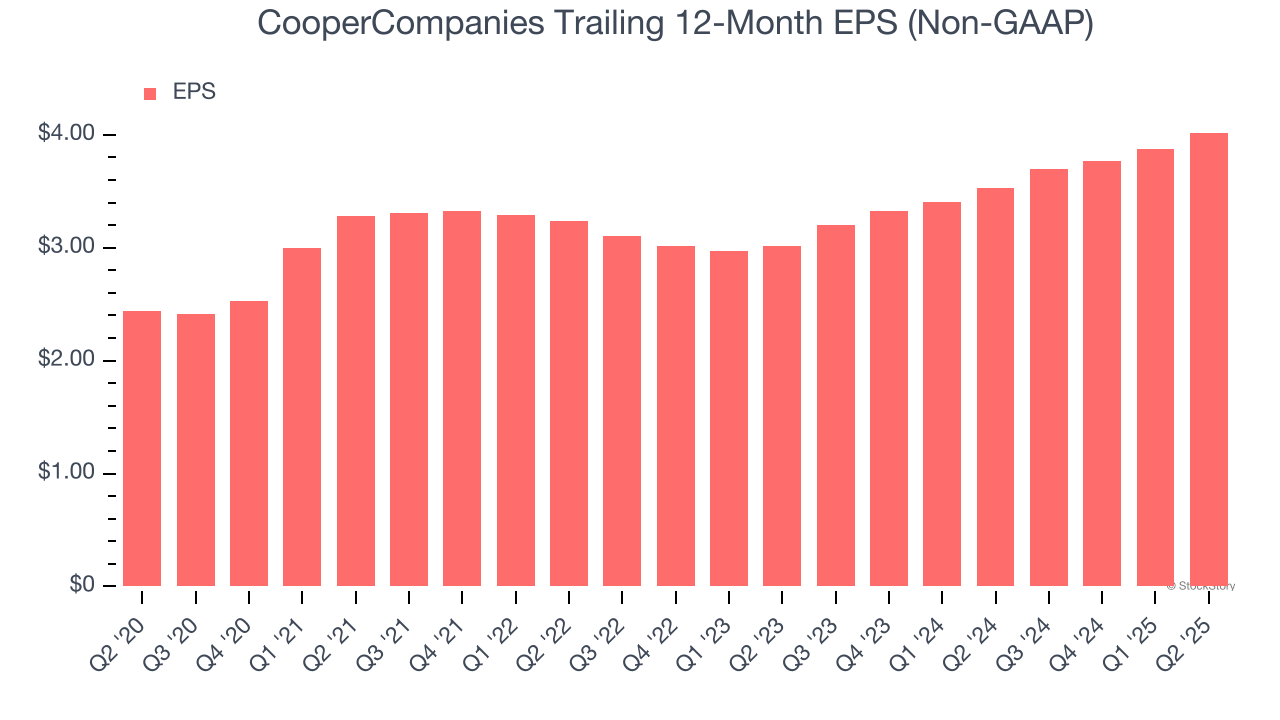
In Q2, CooperCompanies reported adjusted EPS of $1.10, up from $0.96 in the same quarter last year. This print beat analysts’ estimates by 3%. Over the next 12 months, Wall Street expects CooperCompanies’s full-year EPS of $4.02 to grow 8%.
Key Takeaways from CooperCompanies’s Q2 Results
It was good to see CooperCompanies narrowly top analysts’ full-year EPS guidance expectations this quarter. We were also glad its EPS outperformed Wall Street’s estimates. On the other hand, its revenue guidance for next quarter missed and its organic revenue fell short of Wall Street’s estimates. Overall, this was a softer quarter. The stock traded down 11% to $65.98 immediately after reporting.
CooperCompanies didn’t show it’s best hand this quarter, but does that create an opportunity to buy the stock right now? What happened in the latest quarter matters, but not as much as longer-term business quality and valuation, when deciding whether to invest in this stock. We cover that in our actionable full research report which you can read here, it’s free.