Search AI platform provider Elastic (NYSE: ESTC) announced better-than-expected revenue in Q2 CY2025, with sales up 19.5% year on year to $415.3 million. Guidance for next quarter’s revenue was better than expected at $416 million at the midpoint, 1.4% above analysts’ estimates. Its non-GAAP profit of $0.60 per share was 43.4% above analysts’ consensus estimates.
Is now the time to buy Elastic? Find out by accessing our full research report, it’s free.
Elastic (ESTC) Q2 CY2025 Highlights:
- Revenue: $415.3 million vs analyst estimates of $397.2 million (19.5% year-on-year growth, 4.5% beat)
- Adjusted EPS: $0.60 vs analyst estimates of $0.42 (43.4% beat)
- Adjusted Operating Income: $65.13 million vs analyst estimates of $45.77 million (15.7% margin, 42.3% beat)
- The company lifted its revenue guidance for the full year to $1.68 billion at the midpoint from $1.66 billion, a 1.3% increase
- Management raised its full-year Adjusted EPS guidance to $2.32 at the midpoint, a 1.8% increase
- Operating Margin: -2.3%, up from -9.7% in the same quarter last year
- Free Cash Flow Margin: 25.1%, up from 21.8% in the previous quarter
- Customers: 1,550 customers paying more than $100,000 annually
- Net Revenue Retention Rate: 112%, in line with the previous quarter
- Billings: $317.4 million at quarter end, up 14.1% year on year
- Market Capitalization: $8.80 billion
Company Overview
Built on the powerful open-source Elasticsearch technology that powers search functionality for thousands of websites worldwide, Elastic (NYSE: ESTC) provides a search and AI platform that helps organizations find insights from their data, monitor applications, and protect against security threats.
Revenue Growth
Examining a company’s long-term performance can provide clues about its quality. Any business can experience short-term success, but top-performing ones enjoy sustained growth for years. Over the last three years, Elastic grew its sales at a 19% annual rate. Although this growth is acceptable on an absolute basis, it fell slightly short of our standards for the software sector, which enjoys a number of secular tailwinds.
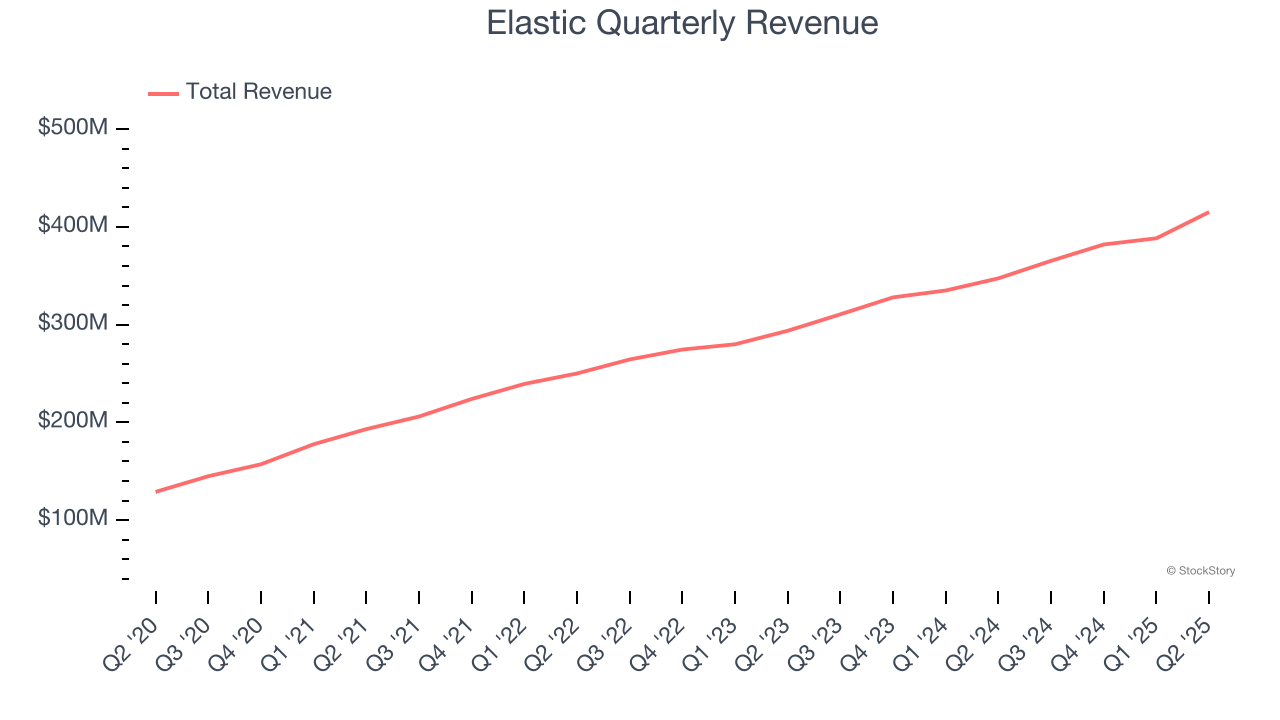
This quarter, Elastic reported year-on-year revenue growth of 19.5%, and its $415.3 million of revenue exceeded Wall Street’s estimates by 4.5%. Company management is currently guiding for a 13.9% year-on-year increase in sales next quarter.
Looking further ahead, sell-side analysts expect revenue to grow 10.5% over the next 12 months, a deceleration versus the last three years. Despite the slowdown, this projection is above average for the sector and suggests the market is forecasting some success for its newer products and services.
Today’s young investors won’t have read the timeless lessons in Gorilla Game: Picking Winners In High Technology because it was written more than 20 years ago when Microsoft and Apple were first establishing their supremacy. But if we apply the same principles, then enterprise software stocks leveraging their own generative AI capabilities may well be the Gorillas of the future. So, in that spirit, we are excited to present our Special Free Report on a profitable, fast-growing enterprise software stock that is already riding the automation wave and looking to catch the generative AI next.
Billings
Billings is a non-GAAP metric that is often called “cash revenue” because it shows how much money the company has collected from customers in a certain period. This is different from revenue, which must be recognized in pieces over the length of a contract.
Elastic’s billings punched in at $317.4 million in Q2, and over the last four quarters, its growth was solid as it averaged 17.9% year-on-year increases. This performance aligned with its total sales growth, indicating robust customer demand. The cash collected from customers also enhances liquidity and provides a solid foundation for future investments and growth. 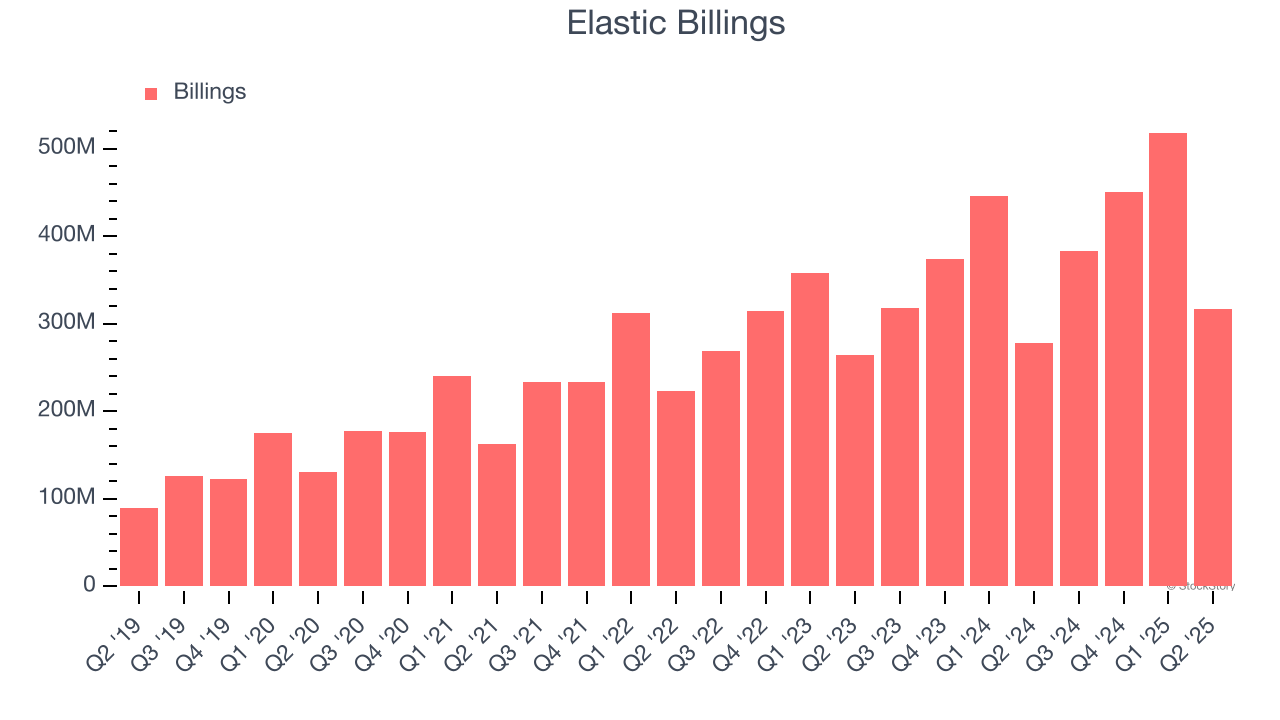
Customer Retention
One of the best parts about the software-as-a-service business model (and a reason why they trade at high valuation multiples) is that customers typically spend more on a company’s products and services over time.
Elastic’s net revenue retention rate, a key performance metric measuring how much money existing customers from a year ago are spending today, was 112% in Q2. This means Elastic would’ve grown its revenue by 12% even if it didn’t win any new customers over the last 12 months.
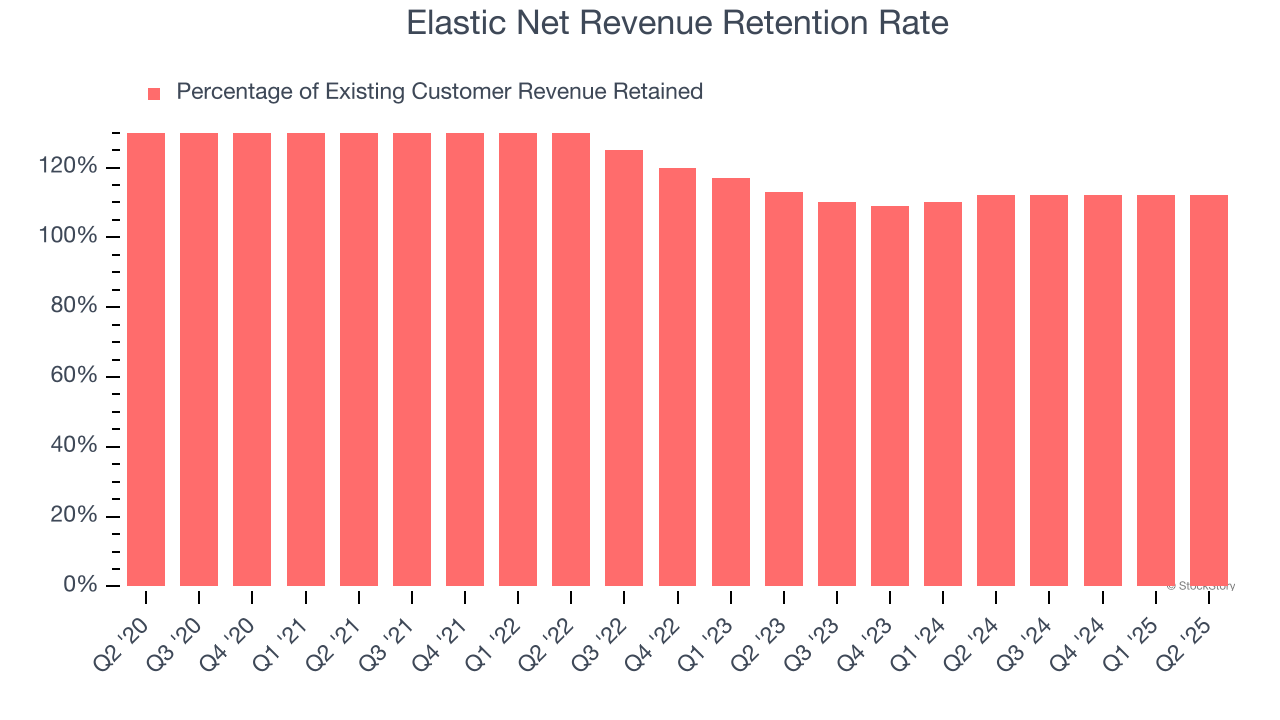
Elastic has a good net retention rate, proving that customers are satisfied with its software and getting more value from it over time, which is always great to see.
Key Takeaways from Elastic’s Q2 Results
We enjoyed seeing Elastic beat analysts’ billings expectations this quarter. We were also glad its full-year EPS guidance exceeded Wall Street’s estimates. On the other hand, its EPS guidance for next quarter missed. Overall, this print had some key positives. The stock traded up 16.8% to $102.50 immediately after reporting.
Big picture, is Elastic a buy here and now? When making that decision, it’s important to consider its valuation, business qualities, as well as what has happened in the latest quarter. We cover that in our actionable full research report which you can read here, it’s free.