
Clothing and accessories retailer Gap (NYSE: GAP) met Wall Street’s revenue expectations in Q2 CY2025, but sales were flat year on year at $3.73 billion. The company expects next quarter’s revenue to be around $3.91 billion, close to analysts’ estimates. Its GAAP profit of $0.57 per share was 4% above analysts’ consensus estimates.
Is now the time to buy Gap? Find out by accessing our full research report, it’s free.
Gap (GAP) Q2 CY2025 Highlights:
- Revenue: $3.73 billion vs analyst estimates of $3.74 billion (flat year on year, in line)
- EPS (GAAP): $0.57 vs analyst estimates of $0.55 (4% beat)
- Adjusted EBITDA: $377 million vs analyst estimates of $395.6 million (10.1% margin, 4.7% miss)
- Revenue Guidance for Q3 CY2025 is $3.91 billion at the midpoint, roughly in line with what analysts were expecting
- Operating Margin: 7.8%, in line with the same quarter last year
- Free Cash Flow Margin: 9.4%, down from 12.4% in the same quarter last year
- Same-Store Sales rose 1% year on year (3% in the same quarter last year)
- Market Capitalization: $8.32 billion
"In the second quarter, Gap Inc. overdelivered on profit expectations and achieved our topline goals. With positive comps for the sixth consecutive quarter, fueled by our three largest brands Old Navy, Gap and Banana Republic, it's clear our strategy is working," said President and Chief Executive Officer, Richard Dickson.
Company Overview
Operating under the Gap, Old Navy, Banana Republic, and Athleta brands, Gap (NYSE: GAP) is an apparel and accessories retailer selling casual clothing to men, women, and children.
Revenue Growth
A company’s long-term sales performance can indicate its overall quality. Any business can have short-term success, but a top-tier one grows for years.
With $15.17 billion in revenue over the past 12 months, Gap is one of the larger companies in the consumer retail industry and benefits from a well-known brand that influences purchasing decisions. However, its scale is a double-edged sword because there are only a finite number of places to build new stores, making it harder to find incremental growth. To accelerate sales, Gap likely needs to optimize its pricing or lean into international expansion.
As you can see below, Gap struggled to generate demand over the last six years (we compare to 2019 to normalize for COVID-19 impacts). Its sales dropped by 1.3% annually despite opening new stores and expanding its reach.
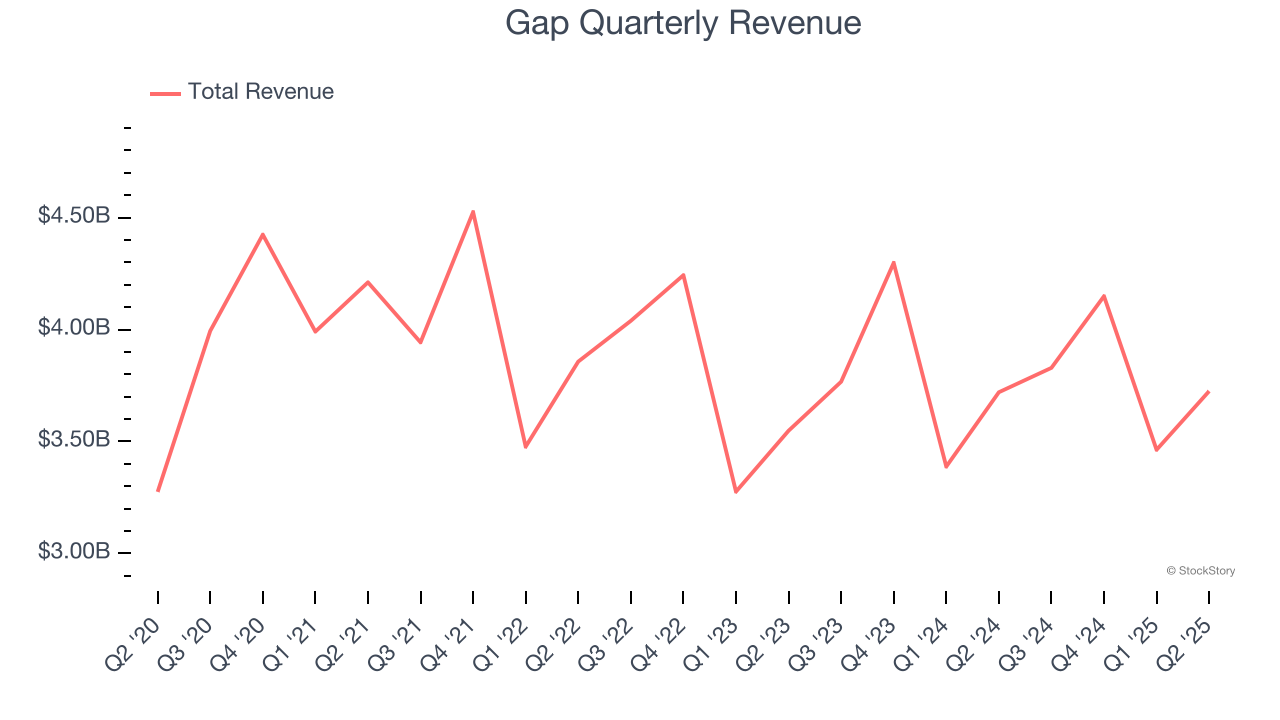
This quarter, Gap’s $3.73 billion of revenue was flat year on year and in line with Wall Street’s estimates. Company management is currently guiding for a 2% year-on-year increase in sales next quarter.
Looking further ahead, sell-side analysts expect revenue to grow 1.8% over the next 12 months. Although this projection suggests its newer products will spur better top-line performance, it is still below average for the sector.
Today’s young investors won’t have read the timeless lessons in Gorilla Game: Picking Winners In High Technology because it was written more than 20 years ago when Microsoft and Apple were first establishing their supremacy. But if we apply the same principles, then enterprise software stocks leveraging their own generative AI capabilities may well be the Gorillas of the future. So, in that spirit, we are excited to present our Special Free Report on a profitable, fast-growing enterprise software stock that is already riding the automation wave and looking to catch the generative AI next.
Store Performance
Number of Stores
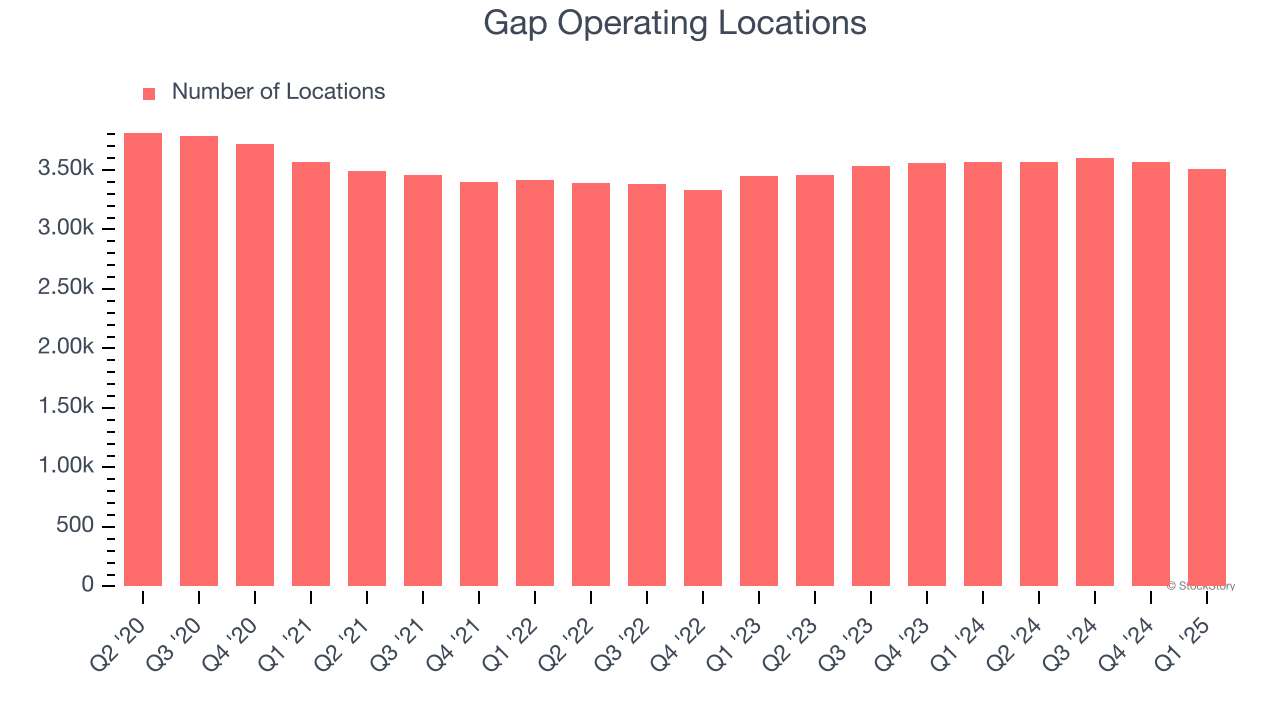
A retailer’s store count influences how much it can sell and how quickly revenue can grow.
Over the last two years, Gap opened new stores quickly, averaging 2.6% annual growth. This was faster than the broader consumer retail sector.
When a retailer opens new stores, it usually means it’s investing for growth because demand is greater than supply, especially in areas where consumers may not have a store within reasonable driving distance.
Note that Gap reports its store count intermittently, so some data points are missing in the chart below.
Same-Store Sales
The change in a company's store base only tells one side of the story. The other is the performance of its existing locations and e-commerce sales, which informs management teams whether they should expand or downsize their physical footprints. Same-store sales provides a deeper understanding of this issue because it measures organic growth at brick-and-mortar shops for at least a year.
Gap’s demand within its existing locations has been relatively stable over the last two years but was below most retailers. On average, the company’s same-store sales have grown by 1.4% per year. This performance suggests it should consider improving its foot traffic and efficiency before expanding its store base.
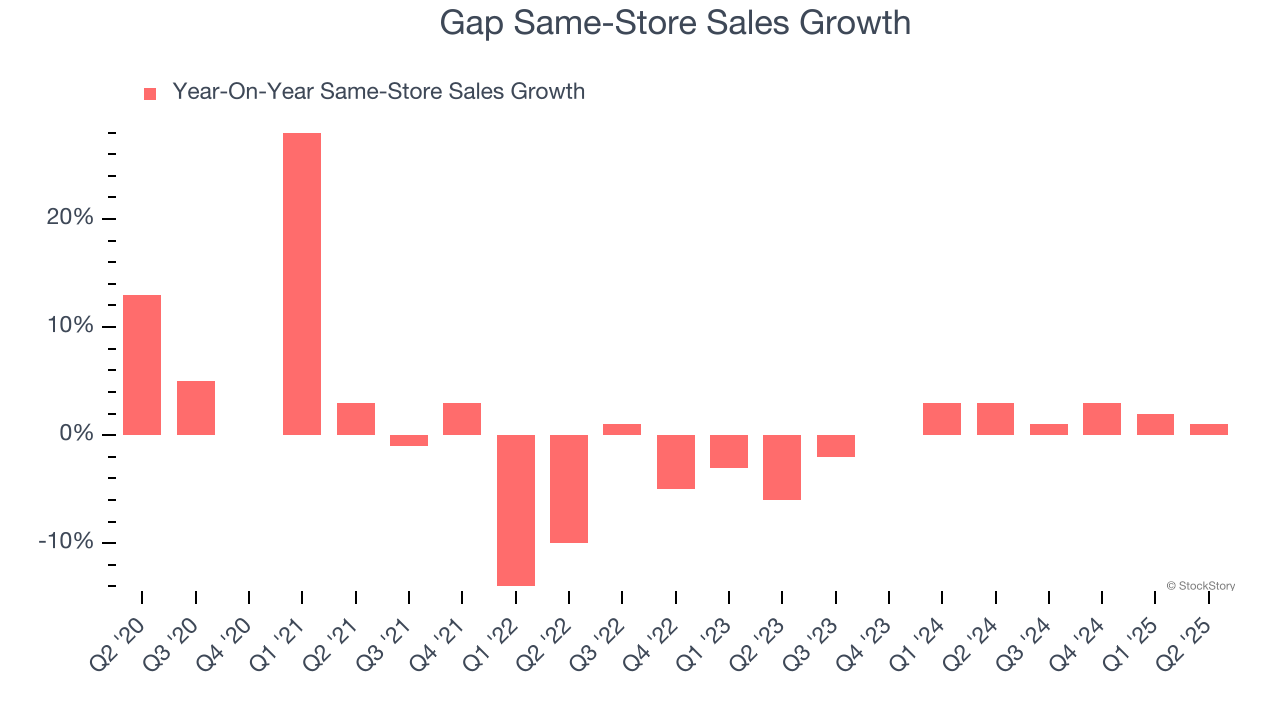
In the latest quarter, Gap’s same-store sales rose 1% year on year. This performance was more or less in line with its historical levels.
Key Takeaways from Gap’s Q2 Results
It was good to see Gap beat analysts’ EPS expectations this quarter. On the other hand, its EBITDA missed and its gross margin fell short of Wall Street’s estimates. Overall, this was a softer quarter. The stock traded down 5.4% to $20.50 immediately following the results.
Gap didn’t show it’s best hand this quarter, but does that create an opportunity to buy the stock right now? When making that decision, it’s important to consider its valuation, business qualities, as well as what has happened in the latest quarter. We cover that in our actionable full research report which you can read here, it’s free.


