
Footwear, apparel, and accessories retailer Genesco (NYSE: GCO) reported revenue ahead of Wall Street’s expectations in Q2 CY2025, with sales up 4% year on year to $546 million. Its non-GAAP loss of $1.14 per share was 8.6% above analysts’ consensus estimates.
Is now the time to buy Genesco? Find out by accessing our full research report, it’s free.
Genesco (GCO) Q2 CY2025 Highlights:
- Revenue: $546 million vs analyst estimates of $532.3 million (4% year-on-year growth, 2.6% beat)
- Adjusted EPS: -$1.14 vs analyst estimates of -$1.25 (8.6% beat)
- Adjusted EBITDA: -$842,000 (-0.2% margin, 122% year-on-year decline)
- Management reiterated its full-year Adjusted EPS guidance of $1.50 at the midpoint
- Operating Margin: -2.6%, in line with the same quarter last year
- Locations: 1,253 at quarter end, down from 1,314 in the same quarter last year
- Same-Store Sales rose 5% year on year (-2% in the same quarter last year)
- Market Capitalization: $355.6 million
Mimi E. Vaughn, Genesco’s Board Chair, President and Chief Executive Officer, said, "We are pleased to report another quarter that exceeded expectations and our fourth consecutive quarter of positive comparable sales growth. The momentum from the second half of last year has continued in Fiscal 2026 highlighted by Journeys high-single digit comp increase as our strategic plan to accelerate growth continues to gain traction. Our focus on product elevation, enhanced customer experience, and strengthened brand positioning is resonating with our broader target teen customer base, as we outperform the market and drive increased share.”
Company Overview
Spanning a broad range of styles, brands, and prices, Genesco (NYSE: GCO) sells footwear, apparel, and accessories through multiple brands and banners.
Revenue Growth
A company’s long-term performance is an indicator of its overall quality. Any business can put up a good quarter or two, but the best consistently grow over the long haul. Regrettably, Genesco’s sales grew at a sluggish 4.6% compounded annual growth rate over the last five years. This was below our standard for the consumer discretionary sector and is a tough starting point for our analysis.
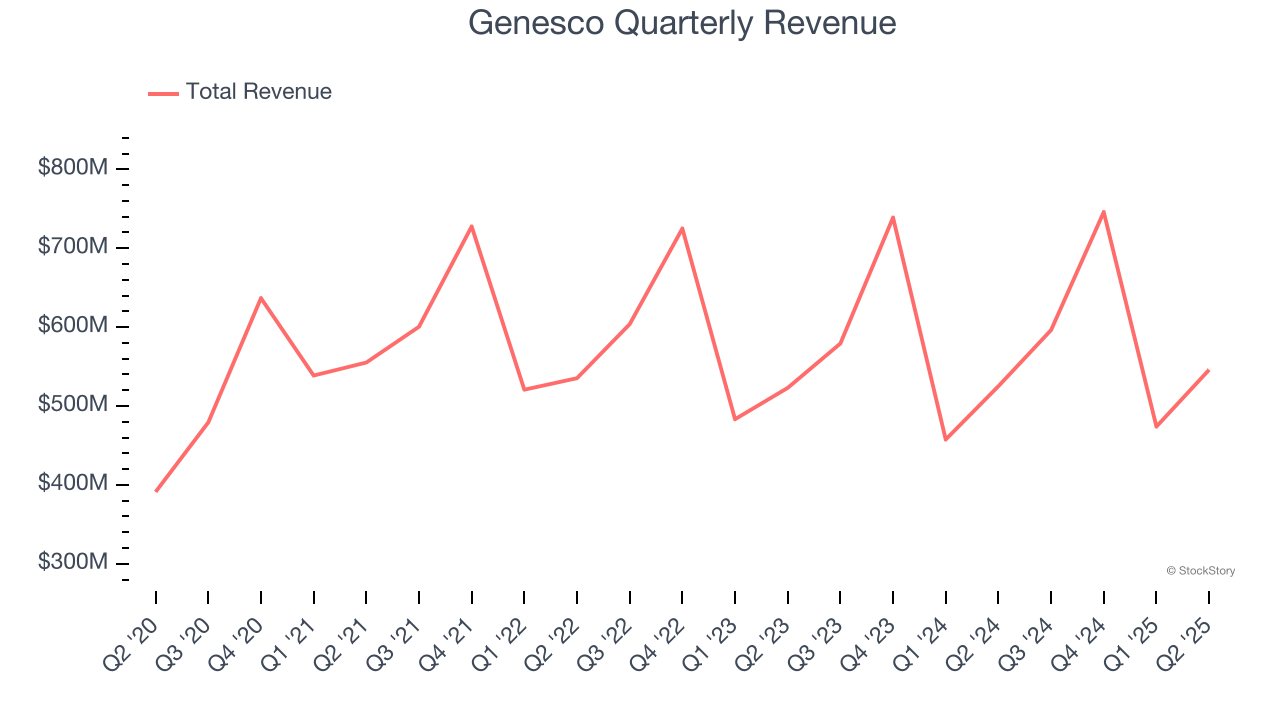
We at StockStory place the most emphasis on long-term growth, but within consumer discretionary, a stretched historical view may miss a company riding a successful new product or trend. Genesco’s recent performance shows its demand has slowed as its revenue was flat over the last two years. 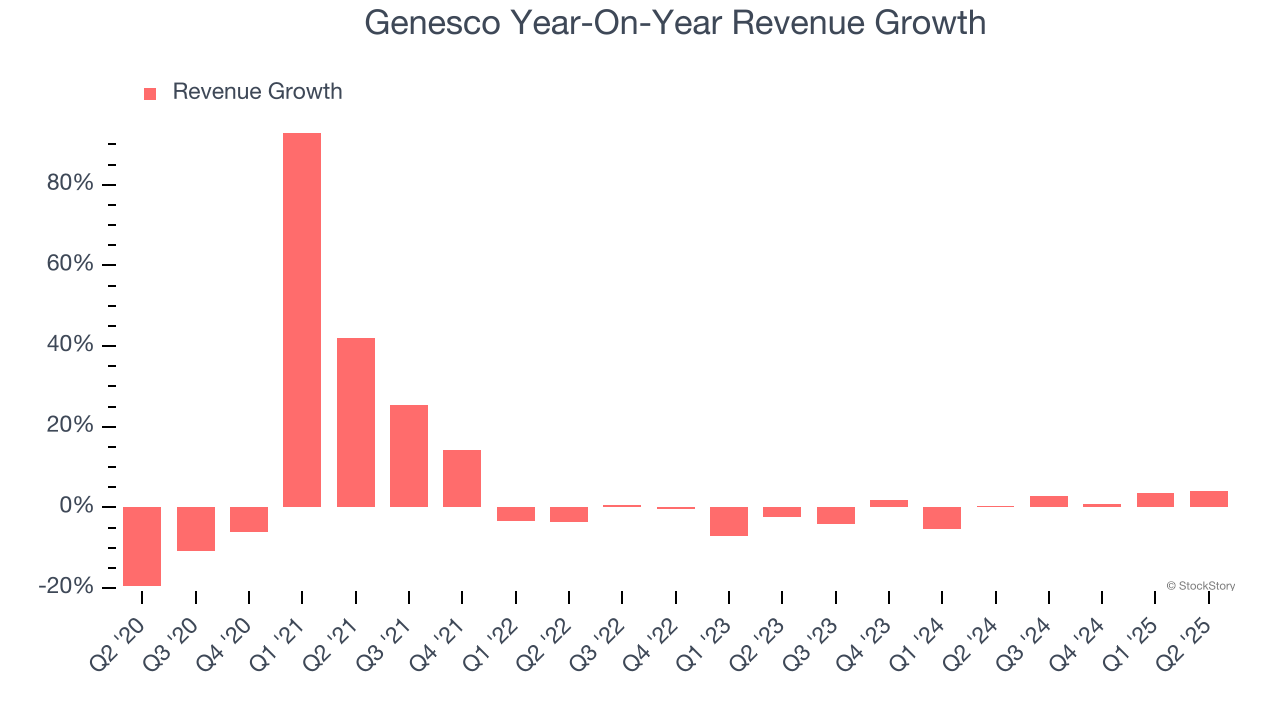
We can better understand the company’s revenue dynamics by analyzing its same-store sales, which show how much revenue its established locations generate. Over the last two years, Genesco’s same-store sales averaged 1.4% year-on-year growth. This number doesn’t surprise us as it’s in line with its revenue growth. 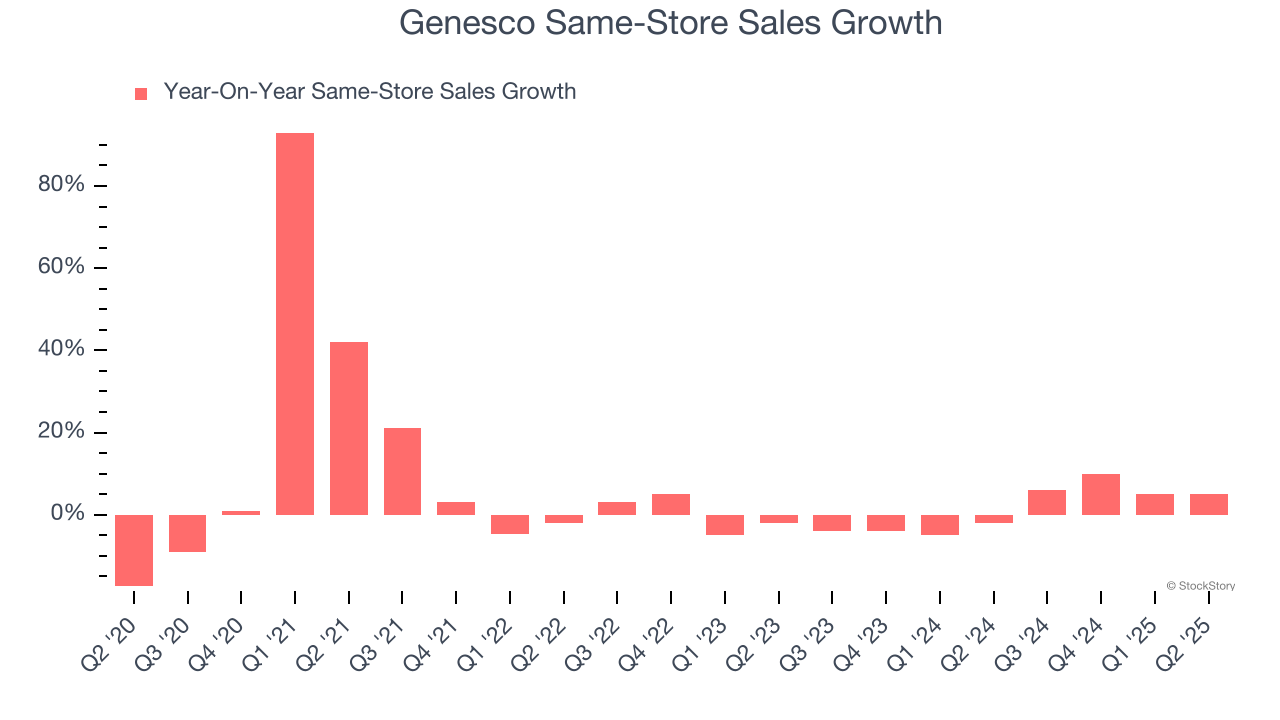
This quarter, Genesco reported modest year-on-year revenue growth of 4% but beat Wall Street’s estimates by 2.6%.
Looking ahead, sell-side analysts expect revenue to remain flat over the next 12 months. This projection doesn't excite us and indicates its newer products and services will not lead to better top-line performance yet.
Software is eating the world and there is virtually no industry left that has been untouched by it. That drives increasing demand for tools helping software developers do their jobs, whether it be monitoring critical cloud infrastructure, integrating audio and video functionality, or ensuring smooth content streaming. Click here to access a free report on our 3 favorite stocks to play this generational megatrend.
Operating Margin
Operating margin is a key measure of profitability. Think of it as net income - the bottom line - excluding the impact of taxes and interest on debt, which are less connected to business fundamentals.
Genesco’s operating margin might fluctuated slightly over the last 12 months but has remained more or less the same. The company broke even over the last two years, inadequate for a consumer discretionary business. Its large expense base and inefficient cost structure were the main culprits behind this performance.
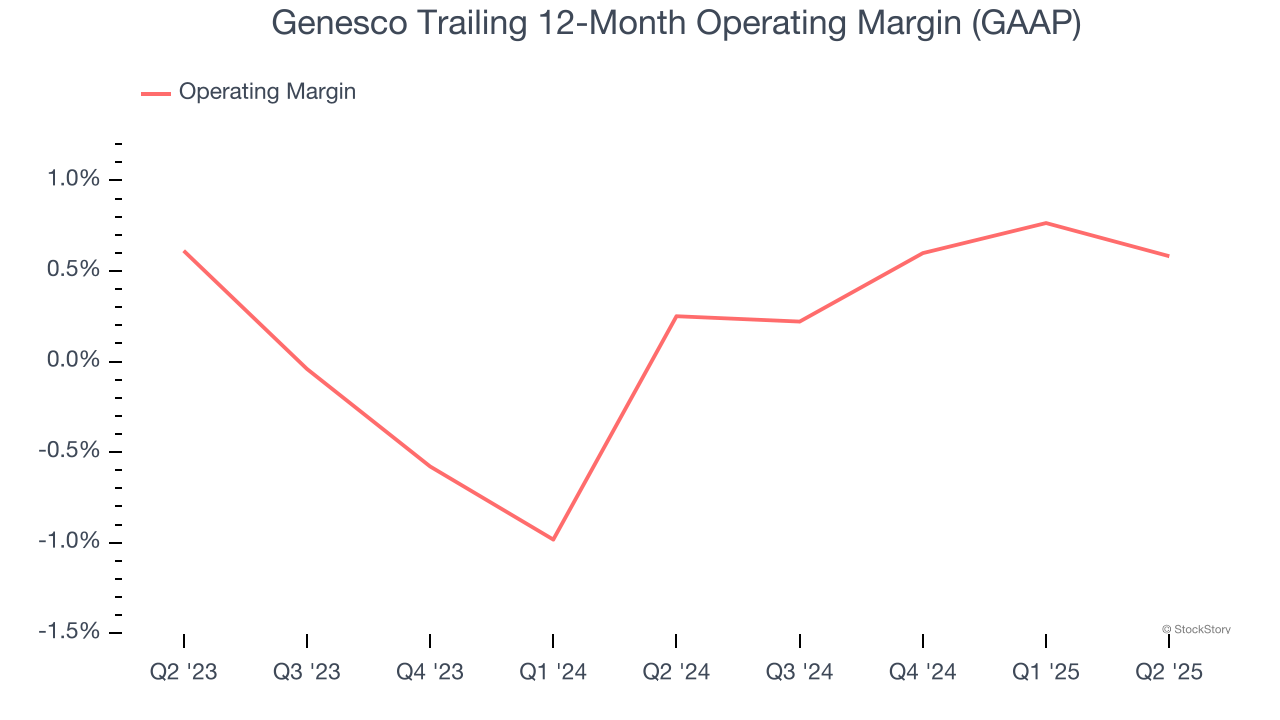
This quarter, Genesco generated an operating margin profit margin of negative 2.6%, in line with the same quarter last year. This indicates the company’s overall cost structure has been relatively stable.
Earnings Per Share
We track the long-term change in earnings per share (EPS) for the same reason as long-term revenue growth. Compared to revenue, however, EPS highlights whether a company’s growth is profitable.
Genesco’s full-year EPS flipped from negative to positive over the last five years. This is encouraging and shows it’s at a critical moment in its life.
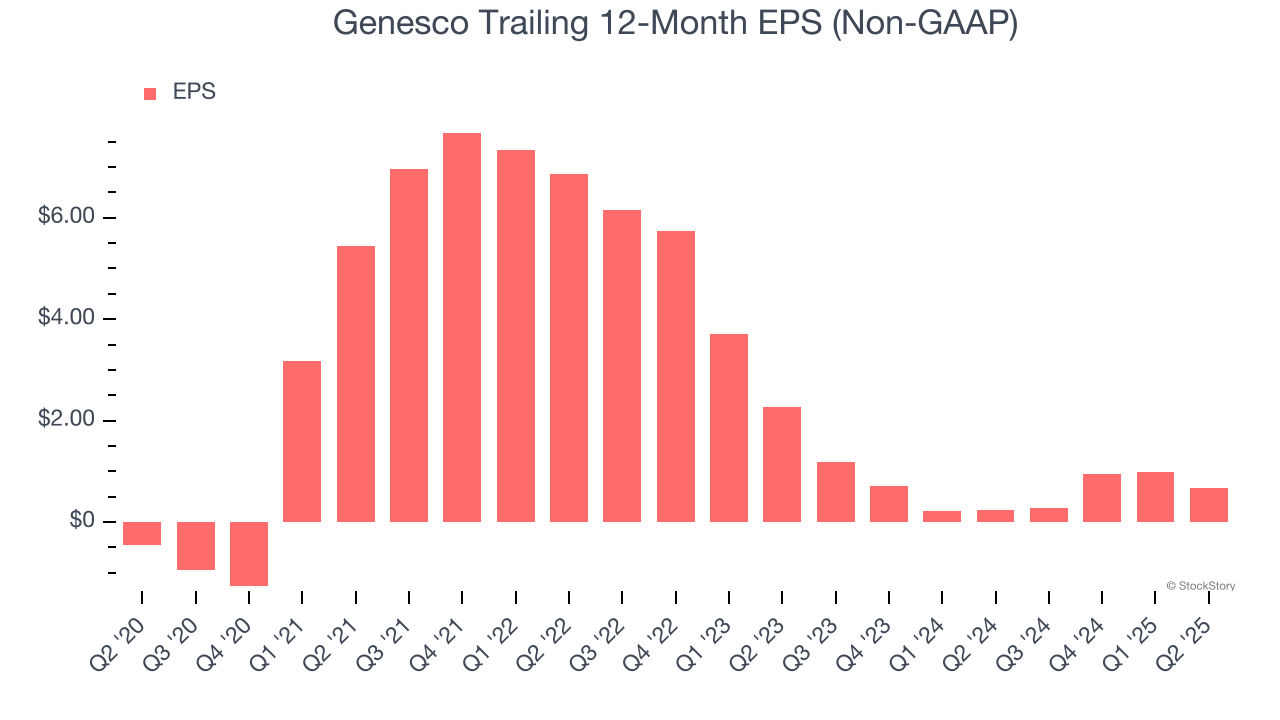
In Q2, Genesco reported adjusted EPS of negative $1.14, down from negative $0.83 in the same quarter last year. Despite falling year on year, this print beat analysts’ estimates by 8.6%. Over the next 12 months, Wall Street expects Genesco’s full-year EPS of $0.68 to grow 174%.
Key Takeaways from Genesco’s Q2 Results
It was encouraging to see Genesco beat analysts’ revenue expectations this quarter. We were also glad its EPS outperformed Wall Street’s estimates. On the other hand, its full-year EPS guidance slightly missed, and the company remained unprofitable. Zooming out, we think this was a mixed quarter. The market seemed to be hoping for more, and the stock traded down 10.9% to $29.40 immediately following the results.
Big picture, is Genesco a buy here and now? The latest quarter does matter, but not nearly as much as longer-term fundamentals and valuation, when deciding if the stock is a buy. We cover that in our actionable full research report which you can read here, it’s free.