
Self defense company AXON (NASDAQ: AXON) reported Q2 CY2025 results topping the market’s revenue expectations, with sales up 32.8% year on year to $668.5 million. The company’s full-year revenue guidance of $2.69 billion at the midpoint came in 1.2% above analysts’ estimates. Its non-GAAP profit of $2.12 per share was 45% above analysts’ consensus estimates.
Is now the time to buy Axon? Find out by accessing our full research report, it’s free.
Axon (AXON) Q2 CY2025 Highlights:
- Revenue: $668.5 million vs analyst estimates of $641 million (32.8% year-on-year growth, 4.3% beat)
- Adjusted EPS: $2.12 vs analyst estimates of $1.46 (45% beat)
- Adjusted EBITDA: $171.6 million vs analyst estimates of $160.7 million (25.7% margin, 6.8% beat)
- The company lifted its revenue guidance for the full year to $2.69 billion at the midpoint from $2.65 billion, a 1.5% increase
- EBITDA guidance for the full year is $675 million at the midpoint, in line with analyst expectations
- Operating Margin: -0.2%, down from 6.7% in the same quarter last year
- Free Cash Flow was -$114.7 million, down from $75.3 million in the same quarter last year
- Market Capitalization: $57.8 billion
Company Overview
Providing body cameras and tasers for first responders, AXON (NASDAQ: AXON) develops technology solutions and weapons products for military, law enforcement, and civilians.
Revenue Growth
A company’s long-term performance is an indicator of its overall quality. Any business can have short-term success, but a top-tier one grows for years. Thankfully, Axon’s 32.3% annualized revenue growth over the last five years was incredible. Its growth surpassed the average industrials company and shows its offerings resonate with customers, a great starting point for our analysis.
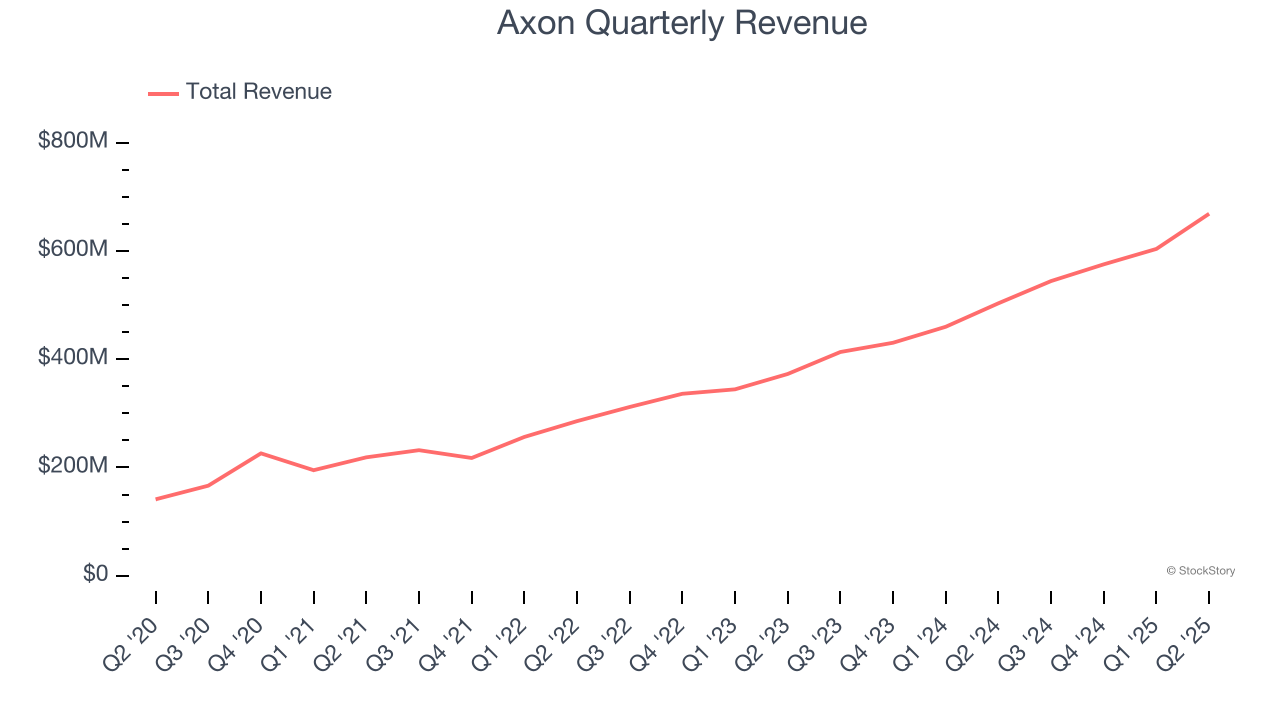
We at StockStory place the most emphasis on long-term growth, but within industrials, a half-decade historical view may miss cycles, industry trends, or a company capitalizing on catalysts such as a new contract win or a successful product line. Axon’s annualized revenue growth of 32.4% over the last two years aligns with its five-year trend, suggesting its demand was predictably strong. 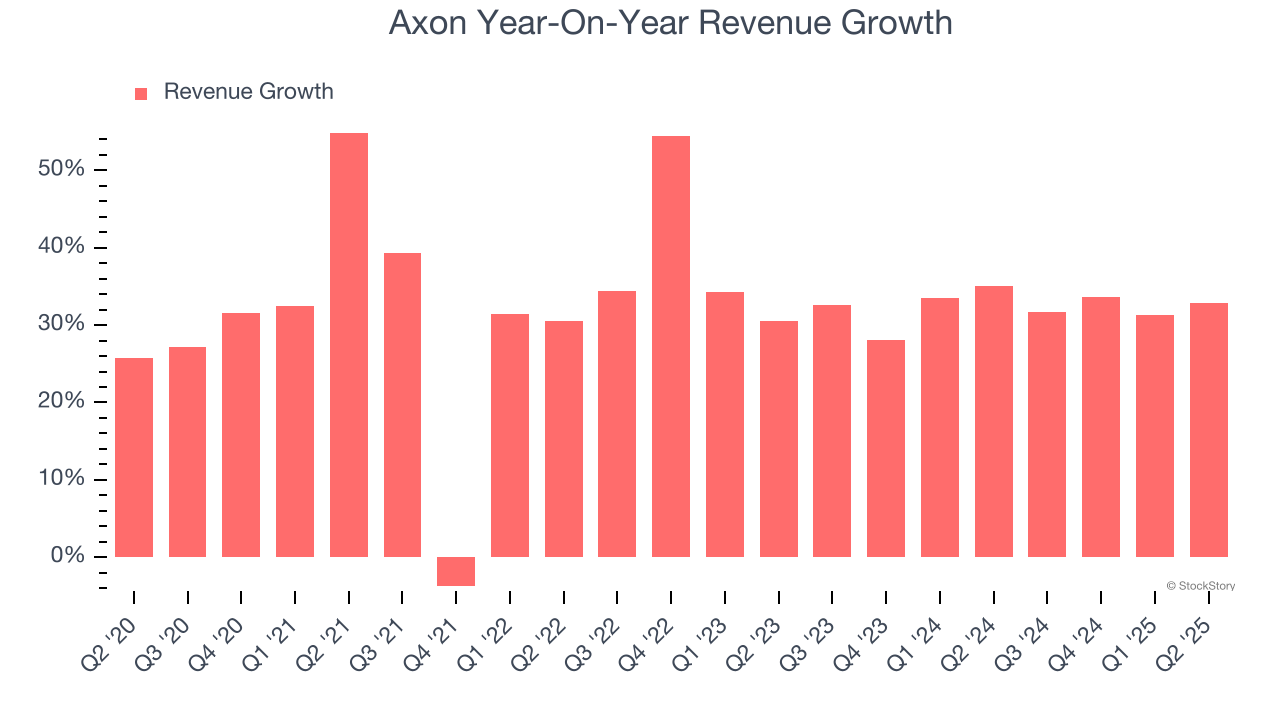
This quarter, Axon reported wonderful year-on-year revenue growth of 32.8%, and its $668.5 million of revenue exceeded Wall Street’s estimates by 4.3%.
Looking ahead, sell-side analysts expect revenue to grow 23.2% over the next 12 months, a deceleration versus the last two years. Despite the slowdown, this projection is healthy and indicates the market is baking in success for its products and services.
Here at StockStory, we certainly understand the potential of thematic investing. Diverse winners from Microsoft (MSFT) to Alphabet (GOOG), Coca-Cola (KO) to Monster Beverage (MNST) could all have been identified as promising growth stories with a megatrend driving the growth. So, in that spirit, we’ve identified a relatively under-the-radar profitable growth stock benefiting from the rise of AI, available to you FREE via this link.
Operating Margin
Operating margin is an important measure of profitability as it shows the portion of revenue left after accounting for all core expenses – everything from the cost of goods sold to advertising and wages. It’s also useful for comparing profitability across companies with different levels of debt and tax rates because it excludes interest and taxes.
Axon was profitable over the last five years but held back by its large cost base. Its average operating margin of 1.8% was weak for an industrials business.
On the plus side, Axon’s operating margin rose by 17.7 percentage points over the last five years, as its sales growth gave it immense operating leverage.
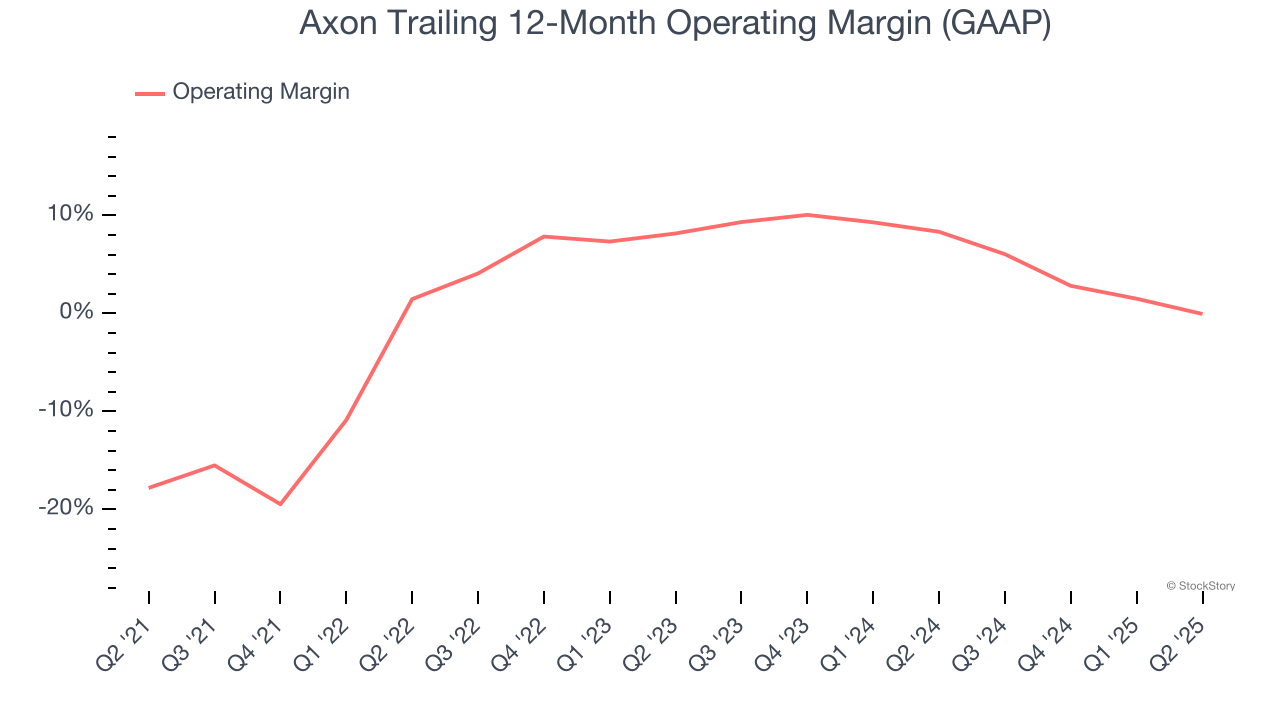
This quarter, Axon’s breakeven margin was down 6.9 percentage points year on year. This contraction shows it was less efficient because its expenses grew faster than its revenue.
Earnings Per Share
Revenue trends explain a company’s historical growth, but the long-term change in earnings per share (EPS) points to the profitability of that growth – for example, a company could inflate its sales through excessive spending on advertising and promotions.
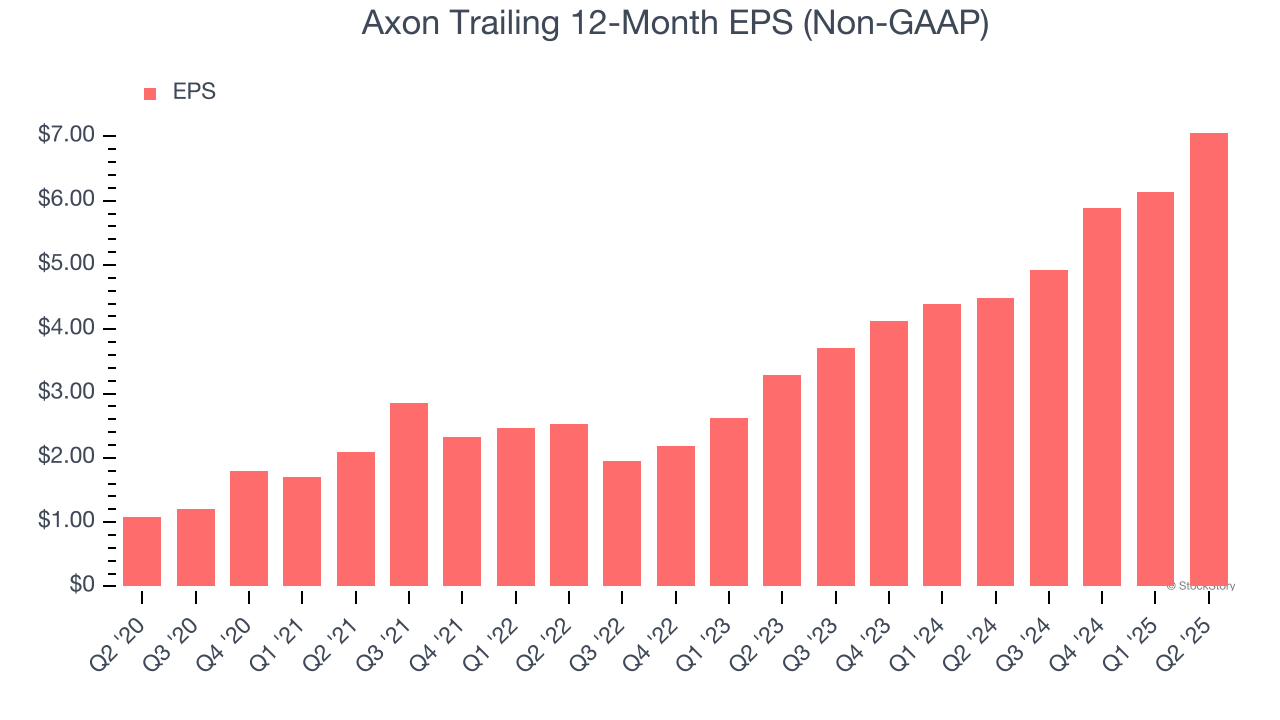
Axon’s EPS grew at an astounding 45.6% compounded annual growth rate over the last five years, higher than its 32.3% annualized revenue growth. This tells us the company became more profitable on a per-share basis as it expanded.
Diving into Axon’s quality of earnings can give us a better understanding of its performance. As we mentioned earlier, Axon’s operating margin declined this quarter but expanded by 17.7 percentage points over the last five years. This was the most relevant factor (aside from the revenue impact) behind its higher earnings; interest expenses and taxes can also affect EPS but don’t tell us as much about a company’s fundamentals.
Like with revenue, we analyze EPS over a more recent period because it can provide insight into an emerging theme or development for the business.
For Axon, its two-year annual EPS growth of 46.5% is similar to its five-year trend, implying strong and stable earnings power.
In Q2, Axon reported adjusted EPS at $2.12, up from $1.20 in the same quarter last year. This print easily cleared analysts’ estimates, and shareholders should be content with the results. Over the next 12 months, Wall Street expects Axon’s full-year EPS of $7.06 to shrink by 6.1%.
Key Takeaways from Axon’s Q2 Results
We were impressed that Axon beat analysts’ revenue and EBITDA expectations this quarter. Looking ahead, full-year revenue guidance was raised, showing a strong demand environment. Zooming out, we think this was a good print with some key areas of upside. The stock traded up 4.1% to $773 immediately following the results.
Axon put up rock-solid earnings, but one quarter doesn’t necessarily make the stock a buy. Let’s see if this is a good investment. If you’re making that decision, you should consider the bigger picture of valuation, business qualities, as well as the latest earnings. We cover that in our actionable full research report which you can read here, it’s free.


