
Financial technology provider Broadridge (NYSE: BR) met Wall Street’s revenue expectations in Q2 CY2025, with sales up 6.2% year on year to $2.07 billion. The company expects next quarter’s revenue to be around $1.51 billion, close to analysts’ estimates. Its non-GAAP profit of $3.55 per share was 1.5% above analysts’ consensus estimates.
Is now the time to buy Broadridge? Find out by accessing our full research report, it’s free.
Broadridge (BR) Q2 CY2025 Highlights:
- Revenue: $2.07 billion vs analyst estimates of $2.06 billion (6.2% year-on-year growth, in line)
- Adjusted EPS: $3.55 vs analyst estimates of $3.50 (1.5% beat)
- Adjusted EBITDA: $605.1 million vs analyst estimates of $618.6 million (29.3% margin, 2.2% miss)
- Revenue Guidance for Q3 CY2025 is $1.51 billion at the midpoint, roughly in line with what analysts were expecting
- Operating Margin: 24.1%, up from 22.7% in the same quarter last year
- Free Cash Flow Margin: 32.1%, down from 35.2% in the same quarter last year
- Market Capitalization: $29.18 billion
"Broadridge delivered strong fiscal year 2025 results with 7% Recurring revenue growth constant currency, 11% Adjusted EPS growth, and $288 million of Closed sales," said Tim Gokey, Broadridge CEO.
Company Overview
Processing over $10 trillion in equity and fixed income trades daily and managing proxy voting for over 800 million equity positions, Broadridge Financial Solutions (NYSE: BR) provides technology-driven solutions that power investing, governance, and communications for banks, broker-dealers, asset managers, and public companies.
Revenue Growth
Reviewing a company’s long-term sales performance reveals insights into its quality. Any business can have short-term success, but a top-tier one grows for years.
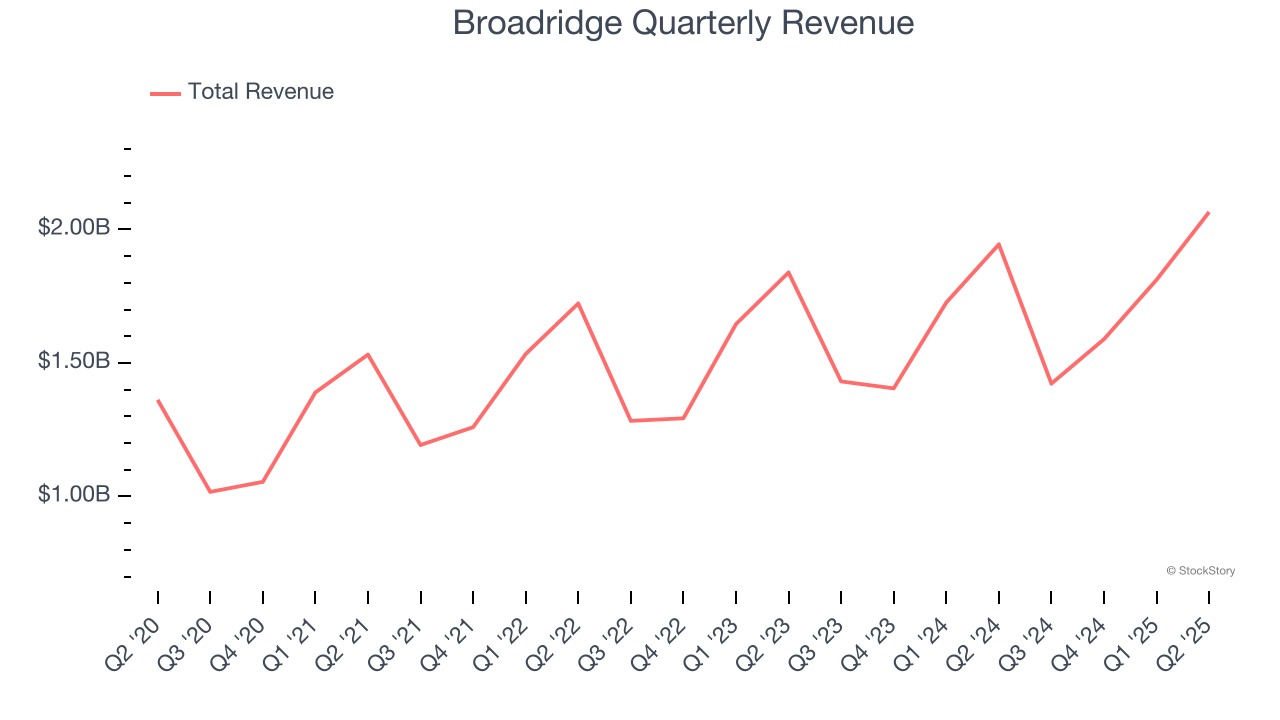
With $6.89 billion in revenue over the past 12 months, Broadridge is one of the larger companies in the business services industry and benefits from a well-known brand that influences purchasing decisions.
As you can see below, Broadridge’s sales grew at a solid 8.8% compounded annual growth rate over the last five years. This is an encouraging starting point for our analysis because it shows Broadridge’s demand was higher than many business services companies.
We at StockStory place the most emphasis on long-term growth, but within business services, a half-decade historical view may miss recent innovations or disruptive industry trends. Broadridge’s annualized revenue growth of 6.6% over the last two years is below its five-year trend, but we still think the results were respectable. 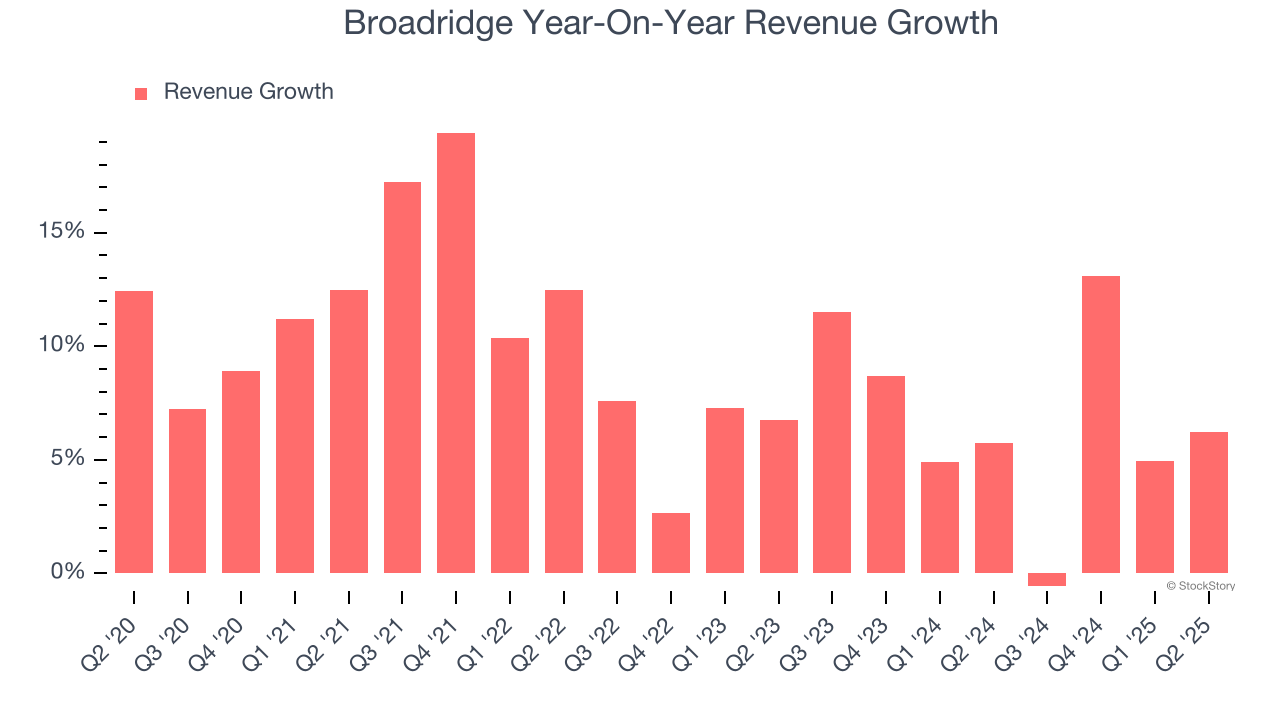
This quarter, Broadridge grew its revenue by 6.2% year on year, and its $2.07 billion of revenue was in line with Wall Street’s estimates. Company management is currently guiding for a 6% year-on-year increase in sales next quarter.
Looking further ahead, sell-side analysts expect revenue to grow 4.7% over the next 12 months, a slight deceleration versus the last two years. This projection doesn't excite us and indicates its products and services will face some demand challenges. At least the company is tracking well in other measures of financial health.
Here at StockStory, we certainly understand the potential of thematic investing. Diverse winners from Microsoft (MSFT) to Alphabet (GOOG), Coca-Cola (KO) to Monster Beverage (MNST) could all have been identified as promising growth stories with a megatrend driving the growth. So, in that spirit, we’ve identified a relatively under-the-radar profitable growth stock benefiting from the rise of AI, available to you FREE via this link.
Operating Margin
Broadridge has been an efficient company over the last five years. It was one of the more profitable businesses in the business services sector, boasting an average operating margin of 15.2%.
Analyzing the trend in its profitability, Broadridge’s operating margin rose by 3.7 percentage points over the last five years, as its sales growth gave it operating leverage.
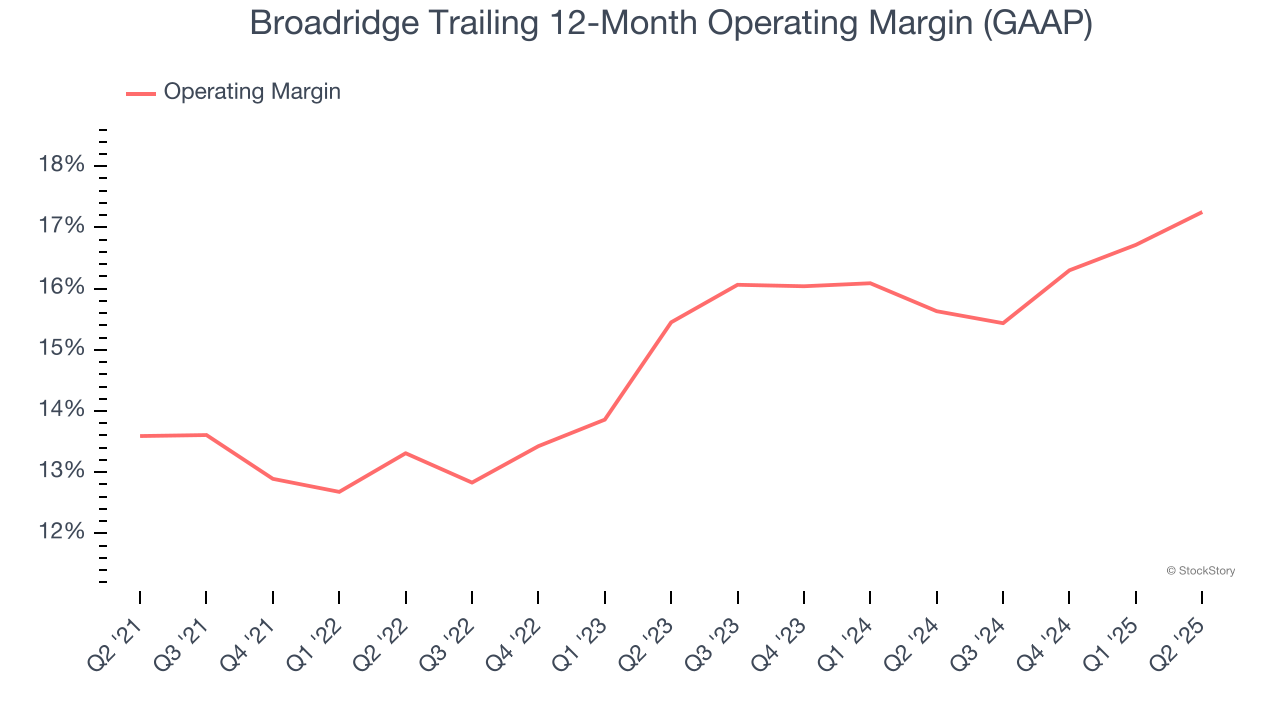
In Q2, Broadridge generated an operating margin profit margin of 24.1%, up 1.4 percentage points year on year. This increase was a welcome development and shows it was more efficient.
Earnings Per Share
We track the long-term change in earnings per share (EPS) for the same reason as long-term revenue growth. Compared to revenue, however, EPS highlights whether a company’s growth is profitable.
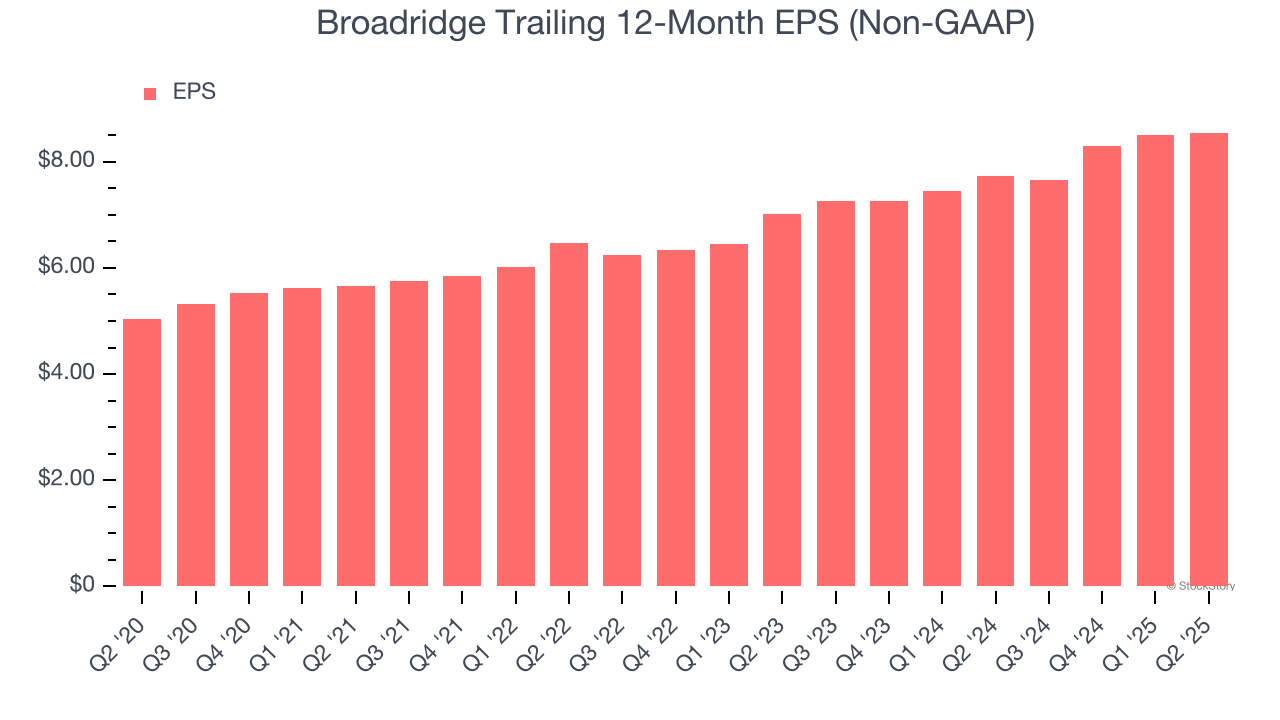
Broadridge’s EPS grew at a remarkable 11.2% compounded annual growth rate over the last five years, higher than its 8.8% annualized revenue growth. This tells us the company became more profitable on a per-share basis as it expanded.
Diving into the nuances of Broadridge’s earnings can give us a better understanding of its performance. As we mentioned earlier, Broadridge’s operating margin expanded by 3.7 percentage points over the last five years. This was the most relevant factor (aside from the revenue impact) behind its higher earnings; interest expenses and taxes can also affect EPS but don’t tell us as much about a company’s fundamentals.
Like with revenue, we analyze EPS over a more recent period because it can provide insight into an emerging theme or development for the business.
For Broadridge, its two-year annual EPS growth of 10.4% is similar to its five-year trend, implying stable earnings power.
In Q2, Broadridge reported adjusted EPS at $3.55, up from $3.50 in the same quarter last year. This print beat analysts’ estimates by 1.5%. Over the next 12 months, Wall Street expects Broadridge’s full-year EPS of $8.55 to grow 7.9%.
Key Takeaways from Broadridge’s Q2 Results
Revenue was in line and EPS beat by a small amount. Revenue guidance for next quarter was also in line. Zooming out, we think this was a quarter with few surprises. The stock remained flat at $247.99 immediately after reporting.
Should you buy the stock or not? When making that decision, it’s important to consider its valuation, business qualities, as well as what has happened in the latest quarter. We cover that in our actionable full research report which you can read here, it’s free.