Affordable single-family home construction company LGI Homes (NASDAQ: LGIH) met Wall Street’s revenue expectations in Q2 CY2025, but sales fell by 19.8% year on year to $483.5 million. Its GAAP profit of $1.36 per share was 3.9% above analysts’ consensus estimates.
Is now the time to buy LGI Homes? Find out by accessing our full research report, it’s free.
LGI Homes (LGIH) Q2 CY2025 Highlights:
- Revenue: $483.5 million vs analyst estimates of $481.4 million (19.8% year-on-year decline, in line)
- EPS (GAAP): $1.36 vs analyst estimates of $1.31 (3.9% beat)
- Operating Margin: 8.2%, down from 11.2% in the same quarter last year
- Backlog: $322.5 million at quarter end, down 41.7% year on year
- Market Capitalization: $1.28 billion
“We delivered solid results in the second quarter including profitability metrics at the high end of our prior guidance range,” said Eric Lipar, Chairman and Chief Executive Officer of LGI Homes.
Company Overview
Based in Texas, LGI Homes (NASDAQ: LGIH) is a homebuilding company specializing in constructing affordable, entry-level single-family homes in desirable communities across the United States.
Revenue Growth
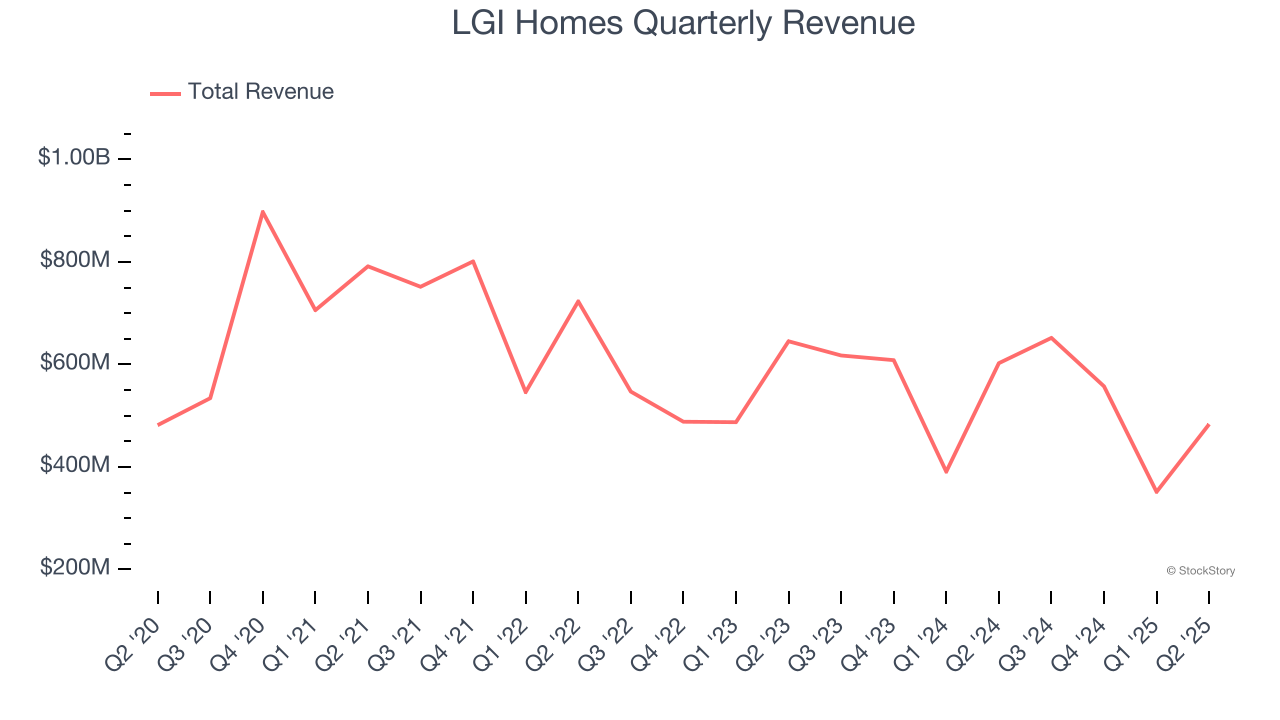
Examining a company’s long-term performance can provide clues about its quality. Even a bad business can shine for one or two quarters, but a top-tier one grows for years. Unfortunately, LGI Homes struggled to consistently increase demand as its $2.04 billion of sales for the trailing 12 months was close to its revenue five years ago. This wasn’t a great result and is a sign of poor business quality.
We at StockStory place the most emphasis on long-term growth, but within industrials, a half-decade historical view may miss cycles, industry trends, or a company capitalizing on catalysts such as a new contract win or a successful product line. LGI Homes’s recent performance shows its demand remained suppressed as its revenue has declined by 2.9% annually over the last two years. LGI Homes isn’t alone in its struggles as the Home Builders industry experienced a cyclical downturn, with many similar businesses observing lower sales at this time. 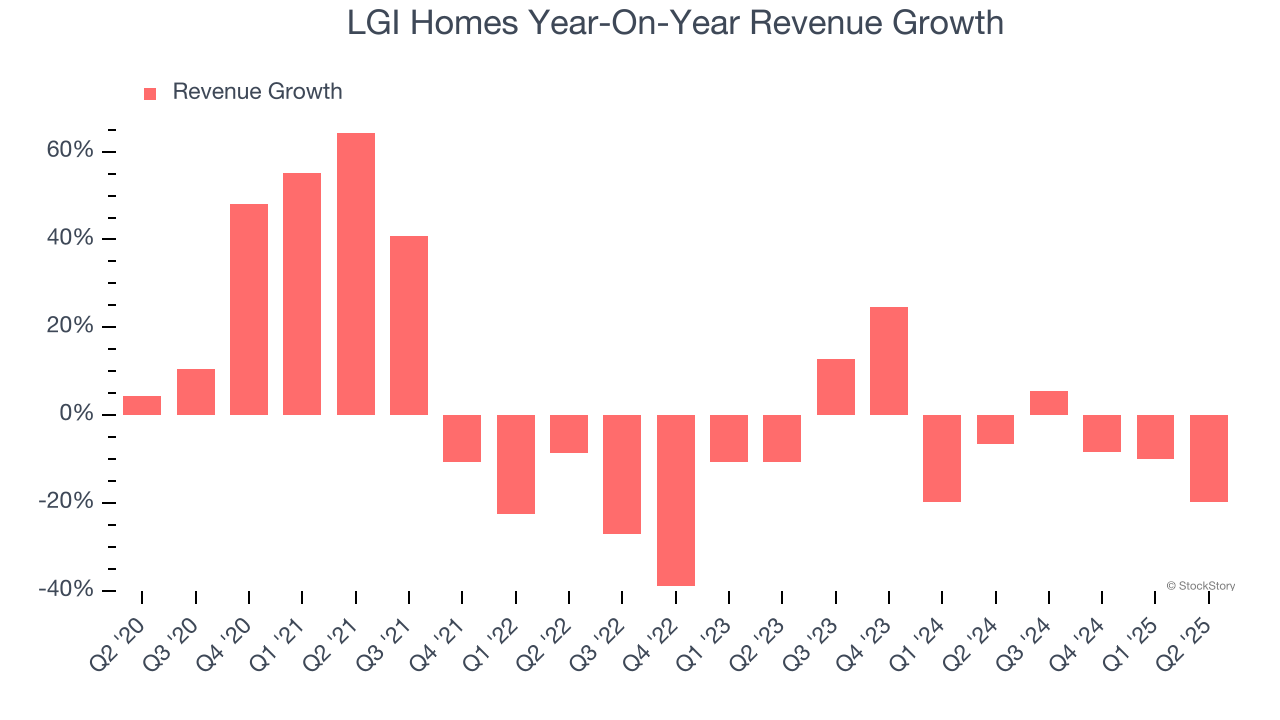
We can better understand the company’s revenue dynamics by analyzing its backlog, or the value of its outstanding orders that have not yet been executed or delivered. LGI Homes’s backlog reached $322.5 million in the latest quarter and averaged 10.4% year-on-year declines over the last two years. Because this number is lower than its revenue growth, we can see the company hasn’t secured enough new orders to maintain its growth rate in the future. 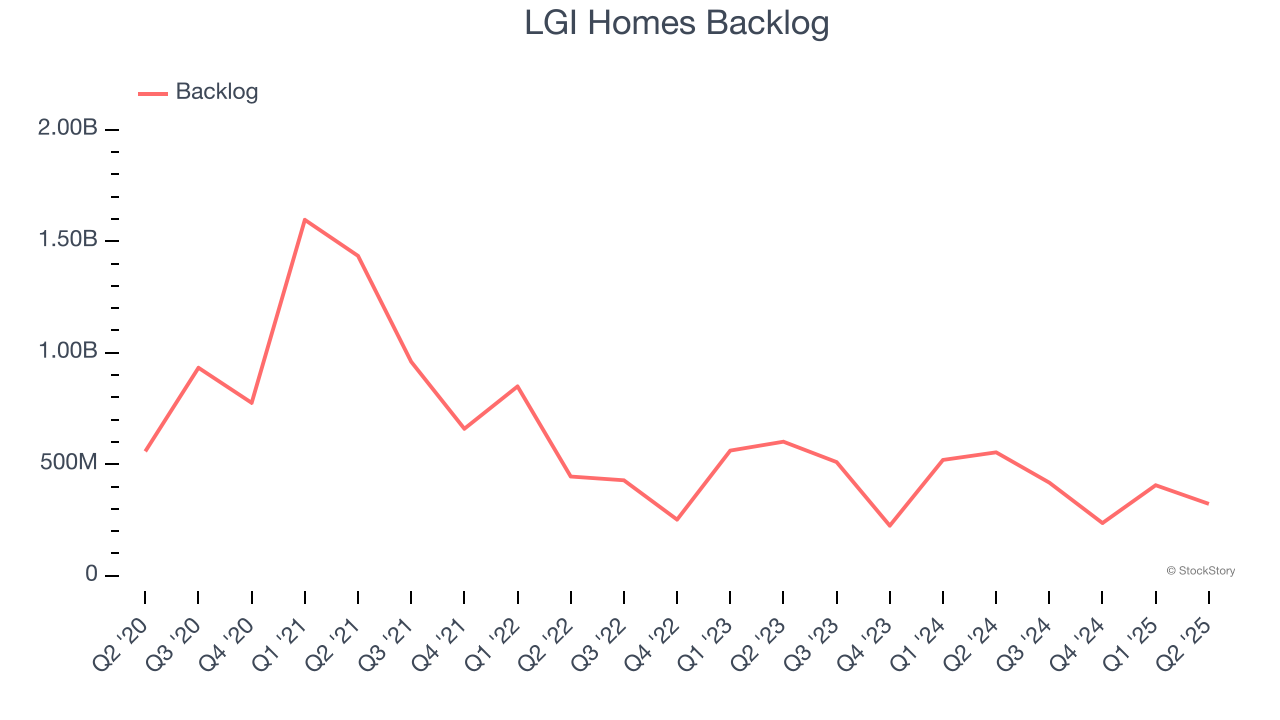
This quarter, LGI Homes reported a rather uninspiring 19.8% year-on-year revenue decline to $483.5 million of revenue, in line with Wall Street’s estimates.
Looking ahead, sell-side analysts expect revenue to grow 21% over the next 12 months, an improvement versus the last two years. This projection is eye-popping and indicates its newer products and services will catalyze better top-line performance.
Here at StockStory, we certainly understand the potential of thematic investing. Diverse winners from Microsoft (MSFT) to Alphabet (GOOG), Coca-Cola (KO) to Monster Beverage (MNST) could all have been identified as promising growth stories with a megatrend driving the growth. So, in that spirit, we’ve identified a relatively under-the-radar profitable growth stock benefiting from the rise of AI, available to you FREE via this link.
Operating Margin
Operating margin is an important measure of profitability as it shows the portion of revenue left after accounting for all core expenses – everything from the cost of goods sold to advertising and wages. It’s also useful for comparing profitability across companies with different levels of debt and tax rates because it excludes interest and taxes.
LGI Homes has been an efficient company over the last five years. It was one of the more profitable businesses in the industrials sector, boasting an average operating margin of 13.7%. This result was particularly impressive because of its low gross margin, which is mostly a factor of what it sells and takes huge shifts to move meaningfully. Companies have more control over their operating margins, and it’s a show of well-managed operations if they’re high when gross margins are low.
Looking at the trend in its profitability, LGI Homes’s operating margin decreased by 9.4 percentage points over the last five years. Even though its historical margin was healthy, shareholders will want to see LGI Homes become more profitable in the future.
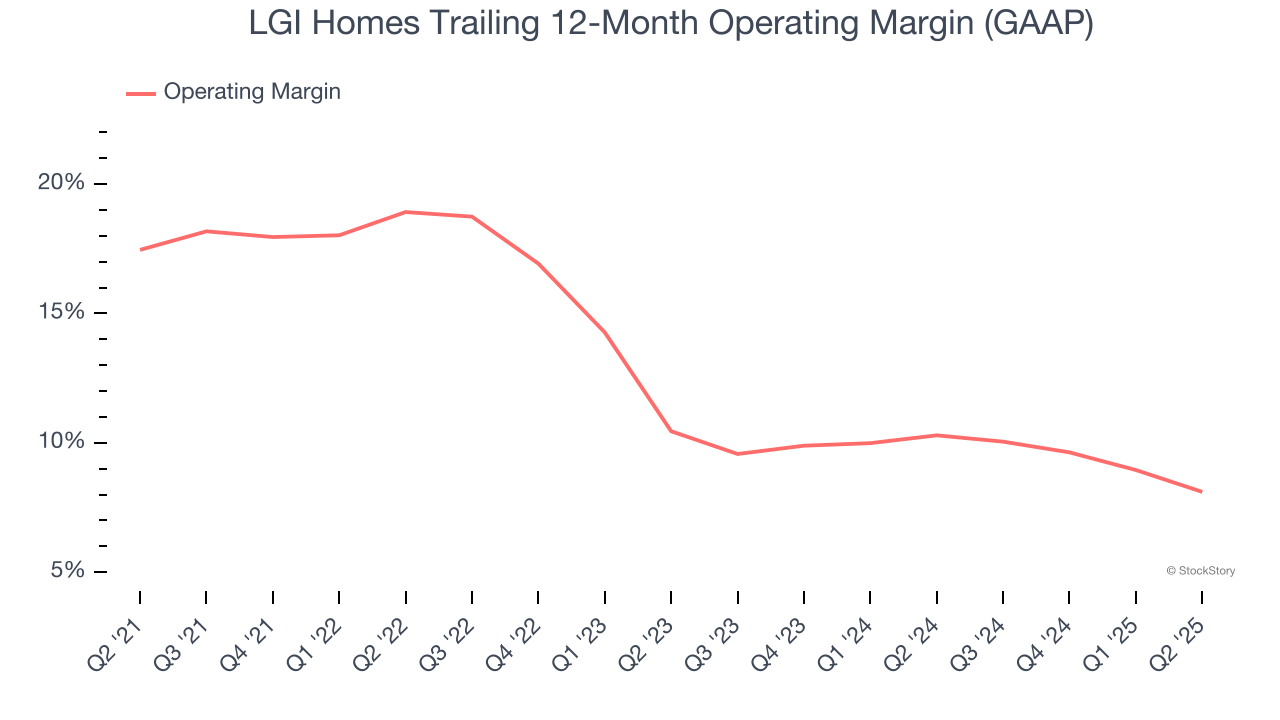
This quarter, LGI Homes generated an operating margin profit margin of 8.2%, down 3 percentage points year on year. Since LGI Homes’s operating margin decreased more than its gross margin, we can assume it was less efficient because expenses such as marketing, R&D, and administrative overhead increased.
Earnings Per Share
We track the long-term change in earnings per share (EPS) for the same reason as long-term revenue growth. Compared to revenue, however, EPS highlights whether a company’s growth is profitable.
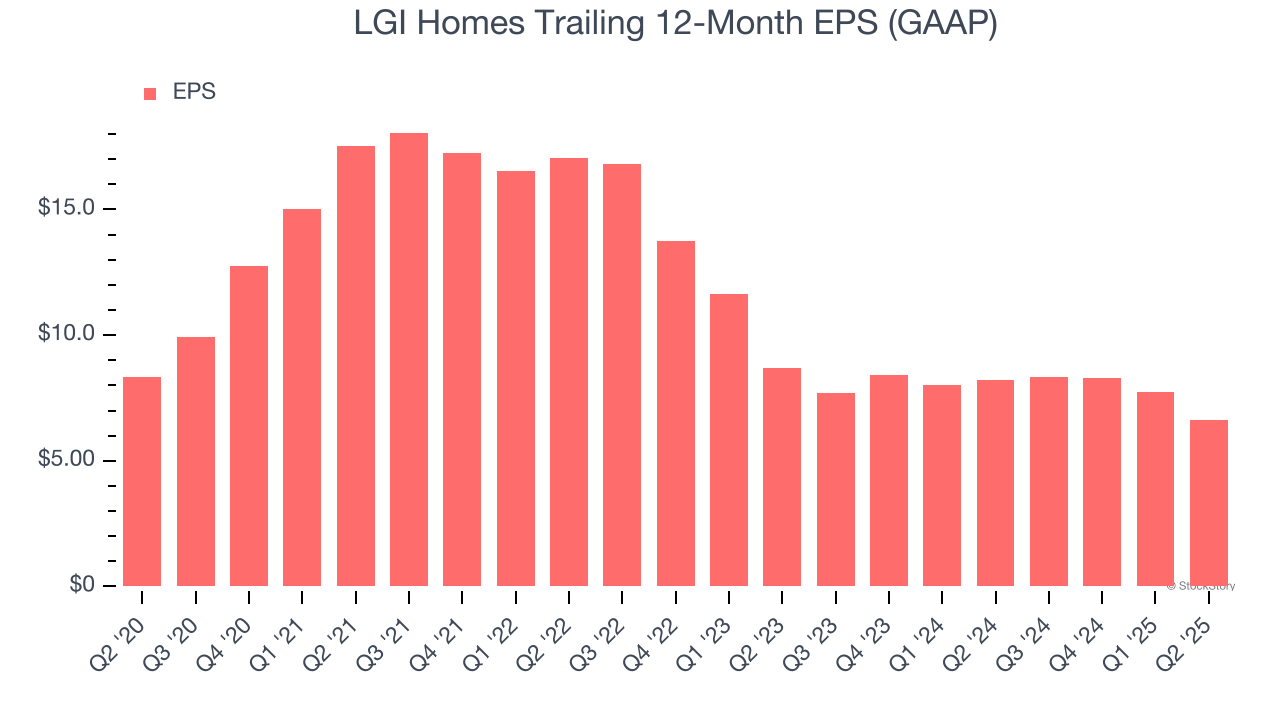
Sadly for LGI Homes, its EPS declined by 4.5% annually over the last five years while its revenue was flat. This tells us the company struggled because its fixed cost base made it difficult to adjust to choppy demand.
We can take a deeper look into LGI Homes’s earnings to better understand the drivers of its performance. As we mentioned earlier, LGI Homes’s operating margin declined by 9.4 percentage points over the last five years. This was the most relevant factor (aside from the revenue impact) behind its lower earnings; interest expenses and taxes can also affect EPS but don’t tell us as much about a company’s fundamentals.
Like with revenue, we analyze EPS over a shorter period to see if we are missing a change in the business.
For LGI Homes, its two-year annual EPS declines of 12.6% show it’s continued to underperform. These results were bad no matter how you slice the data.
In Q2, LGI Homes reported EPS at $1.36, down from $2.48 in the same quarter last year. Despite falling year on year, this print beat analysts’ estimates by 3.9%. Over the next 12 months, Wall Street expects LGI Homes’s full-year EPS of $6.63 to shrink by 1.3%.
Key Takeaways from LGI Homes’s Q2 Results
It was encouraging to see LGI Homes beat analysts’ EPS expectations this quarter. On the other hand, its backlog missed. Overall, this quarter could have been better. The stock traded up 2.6% to $56 immediately after reporting.
Is LGI Homes an attractive investment opportunity right now? When making that decision, it’s important to consider its valuation, business qualities, as well as what has happened in the latest quarter. We cover that in our actionable full research report which you can read here, it’s free.