
Luxury electric car manufacturer Lucid (NASDAQ: LCID) met Wall Street’s revenue expectations in Q2 CY2025, with sales up 29.3% year on year to $259.4 million. Its non-GAAP loss of $0.24 per share was 11.1% below analysts’ consensus estimates.
Is now the time to buy Lucid? Find out by accessing our full research report, it’s free.
Lucid (LCID) Q2 CY2025 Highlights:
- Revenue: $259.4 million vs analyst estimates of $259.1 million (29.3% year-on-year growth, in line)
- Adjusted EPS: -$0.24 vs analyst expectations of -$0.22 (11.1% miss)
- Adjusted EBITDA: -$632.1 million vs analyst estimates of -$624.3 million (-244% margin, 1.2% miss)
- Operating Margin: -310%, up from -393% in the same quarter last year
- Free Cash Flow was -$1.01 billion compared to -$741.3 million in the same quarter last year
- Sales Volumes rose 38.2% year on year (70.5% in the same quarter last year)
- Market Capitalization: $7.40 billion
"We had our sixth consecutive quarter of record deliveries in Q2 and expect to continue this trend as we ramp up Lucid Gravity production in the second half of the year," said Marc Winterhoff, Interim CEO at Lucid.
Company Overview
Founded by a former Tesla Vice President, Lucid Group (NASDAQ: LCID) designs, manufactures, and sells luxury electric vehicles with long-range capabilities.
Revenue Growth
A company’s long-term sales performance is one signal of its overall quality. Any business can experience short-term success, but top-performing ones enjoy sustained growth for years. Luckily, Lucid’s sales grew at an incredible 280% compounded annual growth rate over the last four years. Its growth beat the average industrials company and shows its offerings resonate with customers.
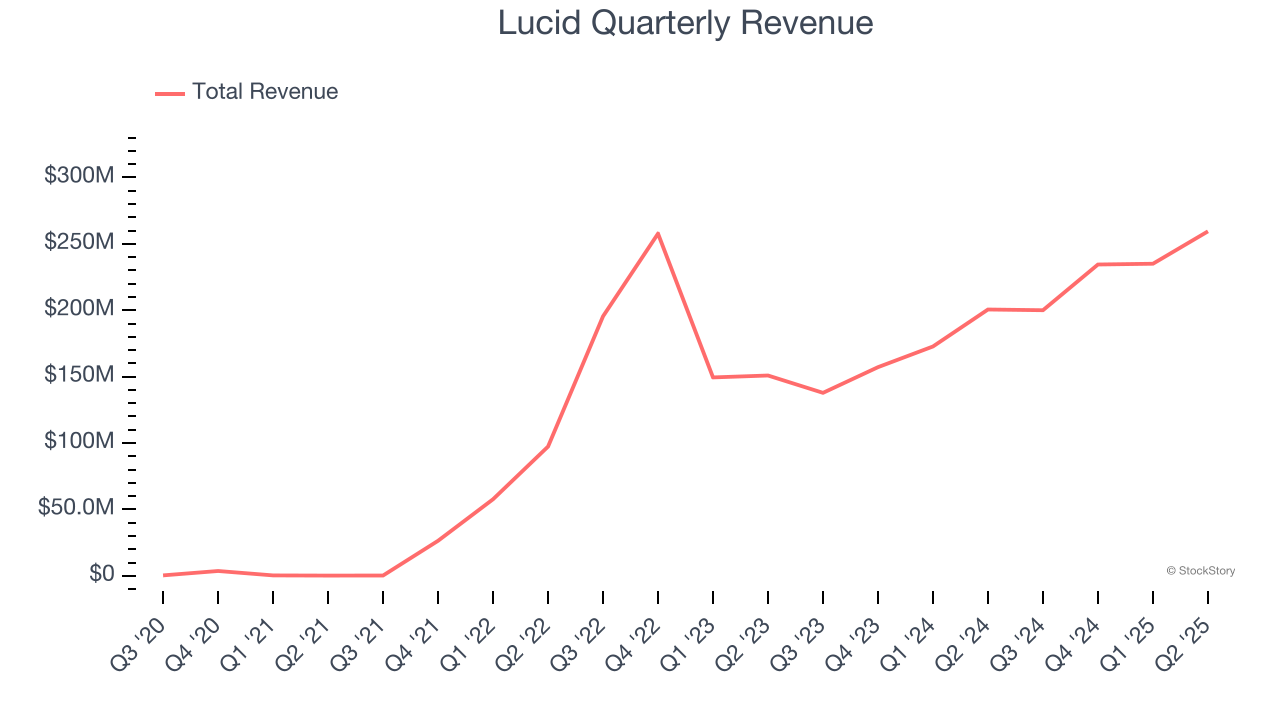
Long-term growth is the most important, but within industrials, a stretched historical view may miss new industry trends or demand cycles. Lucid’s annualized revenue growth of 11% over the last two years is below its four-year trend, but we still think the results suggest healthy demand. 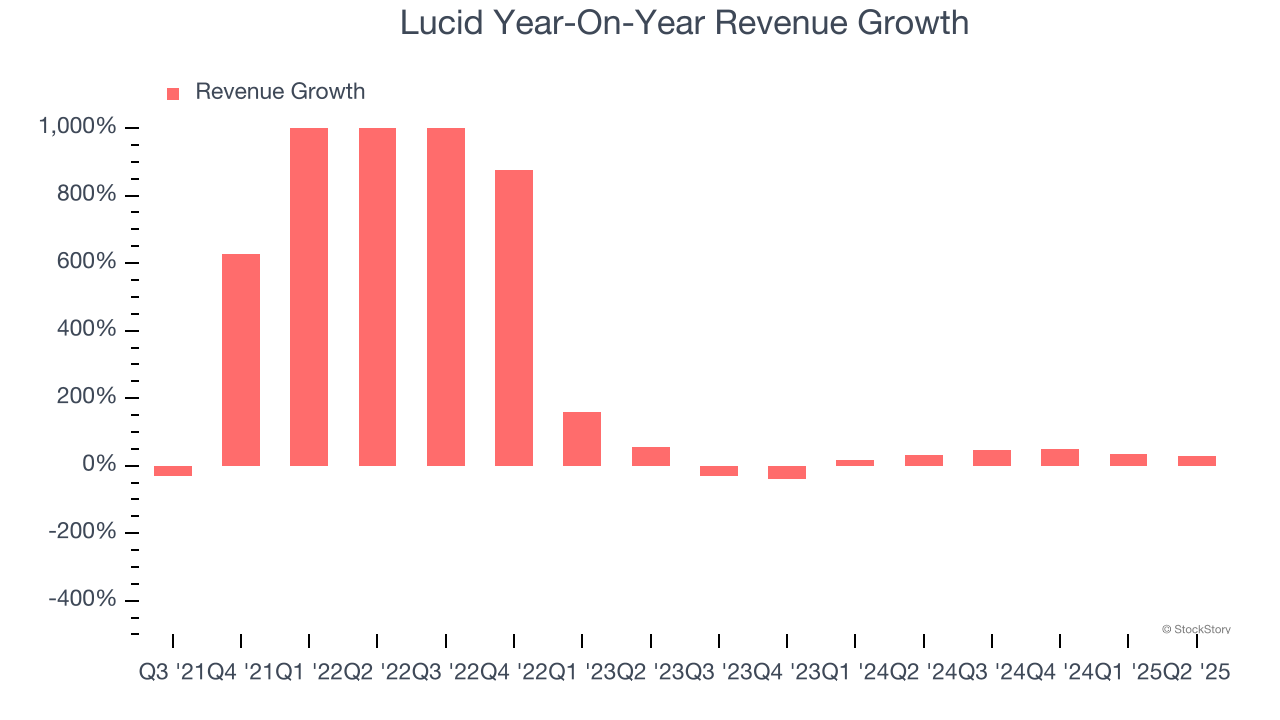
We can dig further into the company’s revenue dynamics by analyzing its number of units sold, which reached 3,309 in the latest quarter. Over the last two years, Lucid’s units sold grew by 41.5% annually. Because this number is better than its revenue growth, we can see the company’s average selling price decreased. 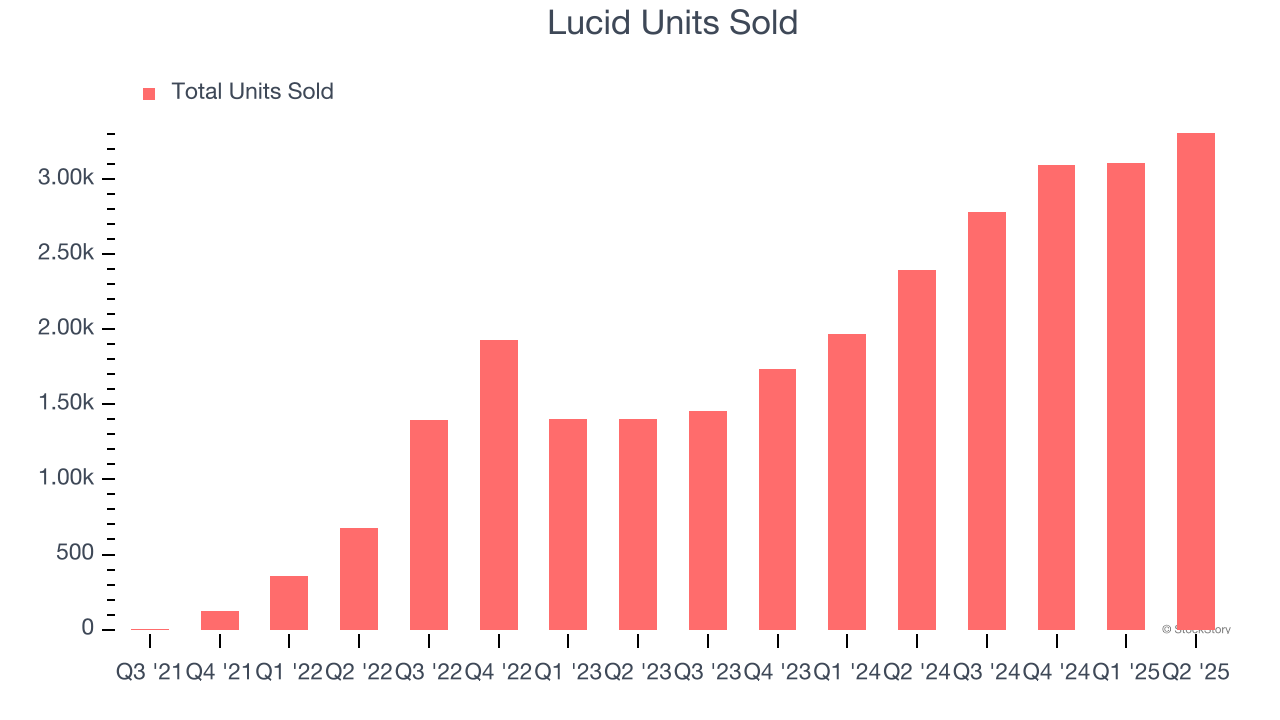
This quarter, Lucid’s year-on-year revenue growth of 29.3% was excellent, and its $259.4 million of revenue was in line with Wall Street’s estimates.
Looking ahead, sell-side analysts expect revenue to grow 121% over the next 12 months, an improvement versus the last two years. This projection is eye-popping and suggests its newer products and services will spur better top-line performance.
Unless you’ve been living under a rock, it should be obvious by now that generative AI is going to have a huge impact on how large corporations do business. While Nvidia and AMD are trading close to all-time highs, we prefer a lesser-known (but still profitable) stock benefiting from the rise of AI. Click here to access our free report one of our favorites growth stories.
Operating Margin
Lucid’s high expenses have contributed to an average operating margin of negative 477% over the last five years. Unprofitable industrials companies require extra attention because they could get caught swimming naked when the tide goes out. It’s hard to trust that the business can endure a full cycle.
On the plus side, Lucid’s operating margin rose over the last five years, as its sales growth gave it operating leverage. Still, it will take much more for the company to reach long-term profitability.
This quarter, Lucid generated a negative 310% operating margin.
Earnings Per Share
Revenue trends explain a company’s historical growth, but the change in earnings per share (EPS) points to the profitability of that growth – for example, a company could inflate its sales through excessive spending on advertising and promotions.
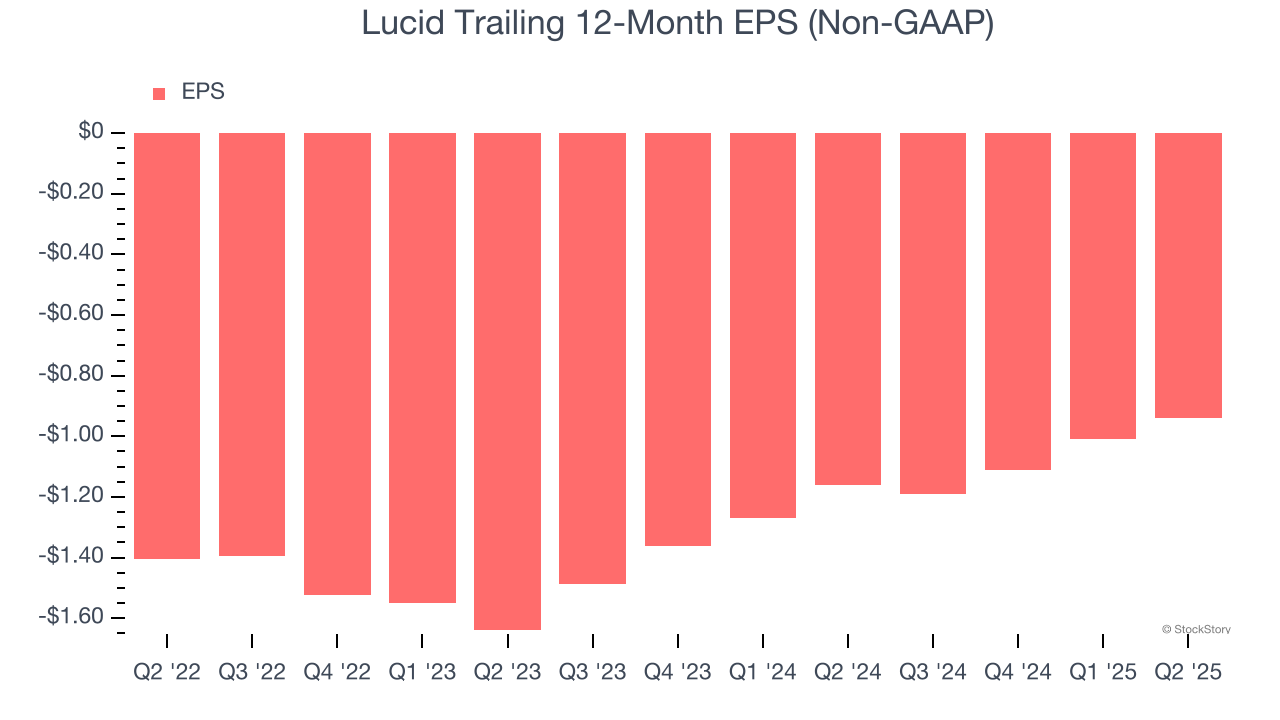
Although Lucid’s full-year earnings are still negative, it reduced its losses and improved its EPS by 24.2% annually over the last two years.
In Q2, Lucid reported adjusted EPS at negative $0.24, up from negative $0.31 in the same quarter last year. Despite growing year on year, this print missed analysts’ estimates. We also like to analyze expected EPS growth based on Wall Street analysts’ consensus projections, but there is insufficient data.
Key Takeaways from Lucid’s Q2 Results
We struggled to find many positives in these results. Its EPS missed and its sales volume fell short of Wall Street’s estimates. Overall, this was a softer quarter. The stock traded down 8.4% to $2.23 immediately following the results.
Lucid may have had a tough quarter, but does that actually create an opportunity to invest right now? The latest quarter does matter, but not nearly as much as longer-term fundamentals and valuation, when deciding if the stock is a buy. We cover that in our actionable full research report which you can read here, it’s free.


