
Dating app company Match (NASDAQ: MTCH) reported Q2 CY2025 results exceeding the market’s revenue expectations, but sales were flat year on year at $863.7 million. Guidance for next quarter’s revenue was optimistic at $915 million at the midpoint, 2.9% above analysts’ estimates. Its GAAP profit of $0.49 per share was in line with analysts’ consensus estimates.
Is now the time to buy Match Group? Find out by accessing our full research report, it’s free.
Match Group (MTCH) Q2 CY2025 Highlights:
- Revenue: $863.7 million vs analyst estimates of $853.7 million (flat year on year, 1.2% beat)
- EPS (GAAP): $0.49 vs analyst estimates of $0.49 (in line)
- Revenue Guidance for Q3 CY2025 is $915 million at the midpoint, above analyst estimates of $889.5 million
- Operating Margin: 22.5%, down from 23.7% in the same quarter last year
- Free Cash Flow Margin: 26.7%, up from 21.4% in the previous quarter
- Payers: 14.1 million, down 741,000 year on year
- Market Capitalization: $8.31 billion
"Six months ago, we took a hard look at how we work, what we build, and what users want from our apps," said CEO Spencer Rascoff.
Company Overview
Originally started as a dial-up service before widespread internet adoption, Match (NASDAQ: MTCH) was an early innovator in online dating and today has a portfolio of apps including Tinder, Hinge, Archer, and OkCupid.
Revenue Growth
A company’s long-term performance is an indicator of its overall quality. Any business can put up a good quarter or two, but many enduring ones grow for years. Unfortunately, Match Group’s 2.5% annualized revenue growth over the last three years was sluggish. This wasn’t a great result, but there are still things to like about Match Group.
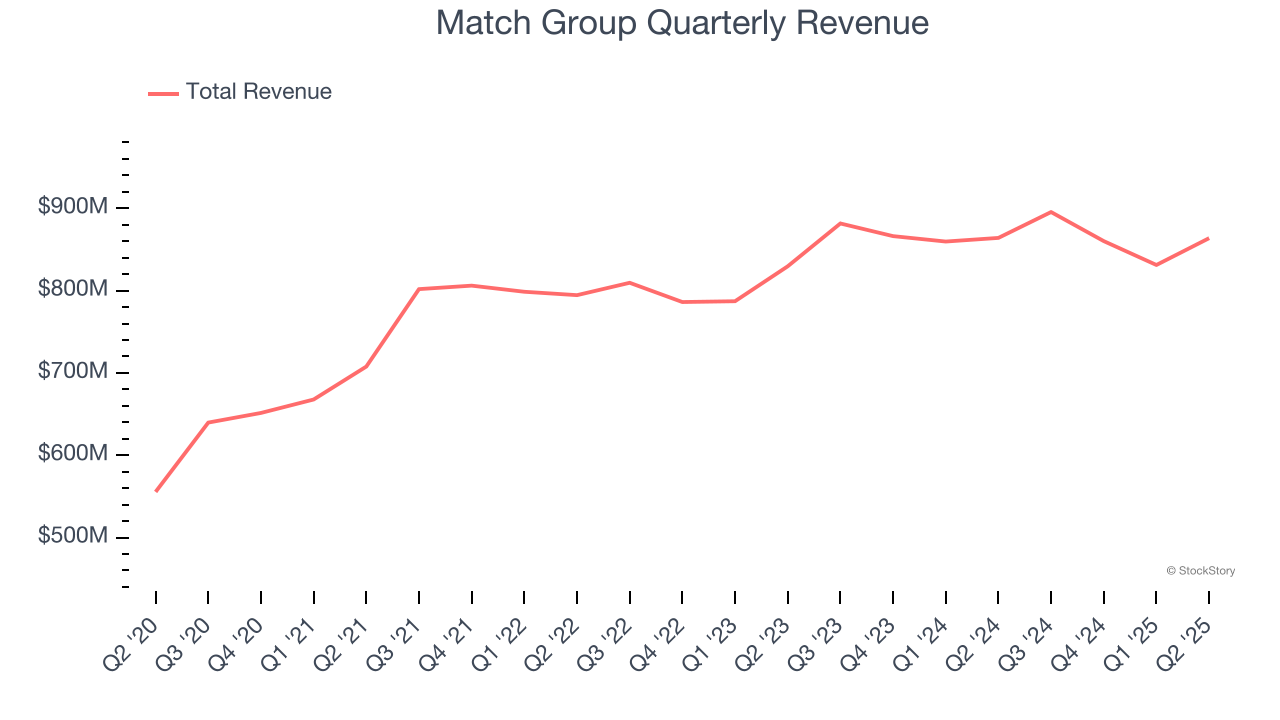
This quarter, Match Group’s $863.7 million of revenue was flat year on year but beat Wall Street’s estimates by 1.2%. Company management is currently guiding for a 2.2% year-on-year increase in sales next quarter.
Looking further ahead, sell-side analysts expect revenue to grow 2.1% over the next 12 months, similar to its three-year rate. This projection is underwhelming and suggests its newer products and services will not catalyze better top-line performance yet. At least the company is tracking well in other measures of financial health.
Software is eating the world and there is virtually no industry left that has been untouched by it. That drives increasing demand for tools helping software developers do their jobs, whether it be monitoring critical cloud infrastructure, integrating audio and video functionality, or ensuring smooth content streaming. Click here to access a free report on our 3 favorite stocks to play this generational megatrend.
Payers
User Growth
As a subscription-based app, Match Group generates revenue growth by expanding both its subscriber base and the amount each subscriber spends over time.
Match Group struggled with new customer acquisition over the last two years as its payers have declined by 4.8% annually to 14.1 million in the latest quarter. This performance isn't ideal because internet usage is secular, meaning there are typically unaddressed market opportunities. If Match Group wants to accelerate growth, it likely needs to enhance the appeal of its current offerings or innovate with new products. 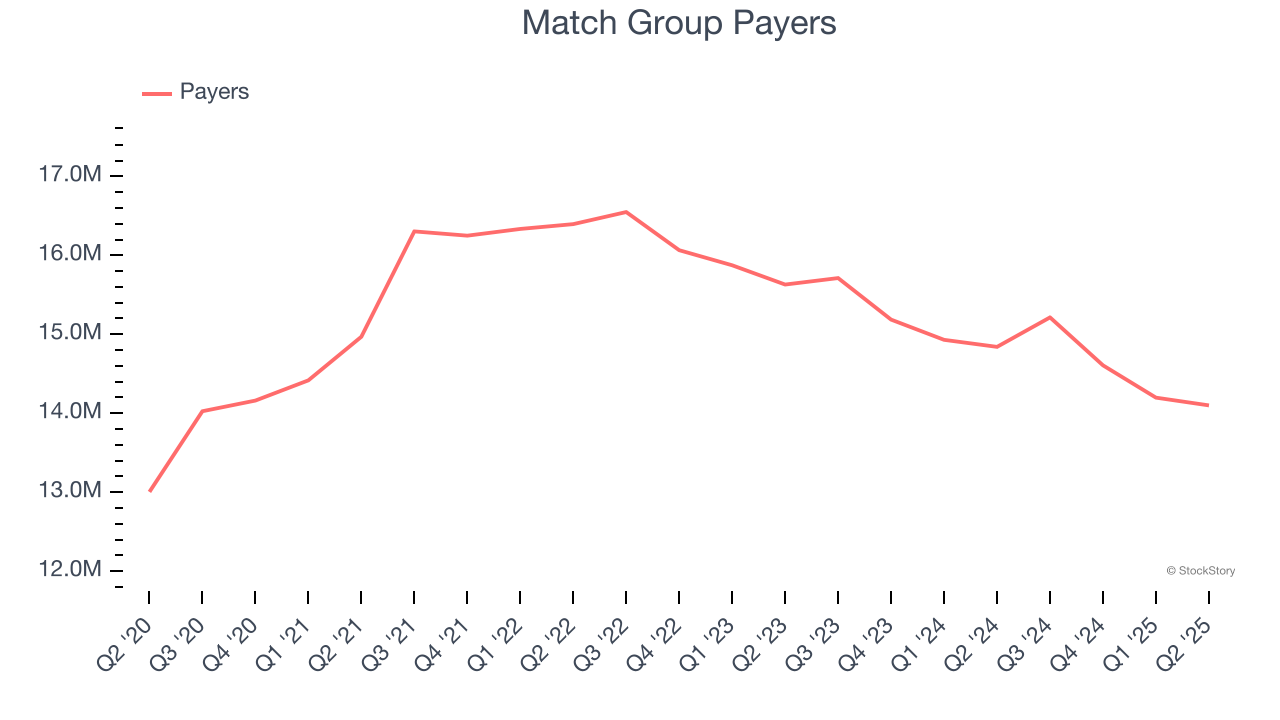
In Q2, Match Group’s payers once again decreased by 741,000, a 5% drop since last year. The quarterly print isn’t too different from its two-year result, suggesting its new initiatives aren’t accelerating user growth just yet.
Revenue Per User
Average revenue per user (ARPU) is a critical metric to track because it measures how much the average user spends. ARPU is also a key indicator of how valuable its users are (and can be over time).
Match Group’s ARPU growth has been impressive over the last two years, averaging 8.9%. Although its payers shrank during this time, the company’s ability to successfully increase monetization demonstrates its platform’s value for existing users. 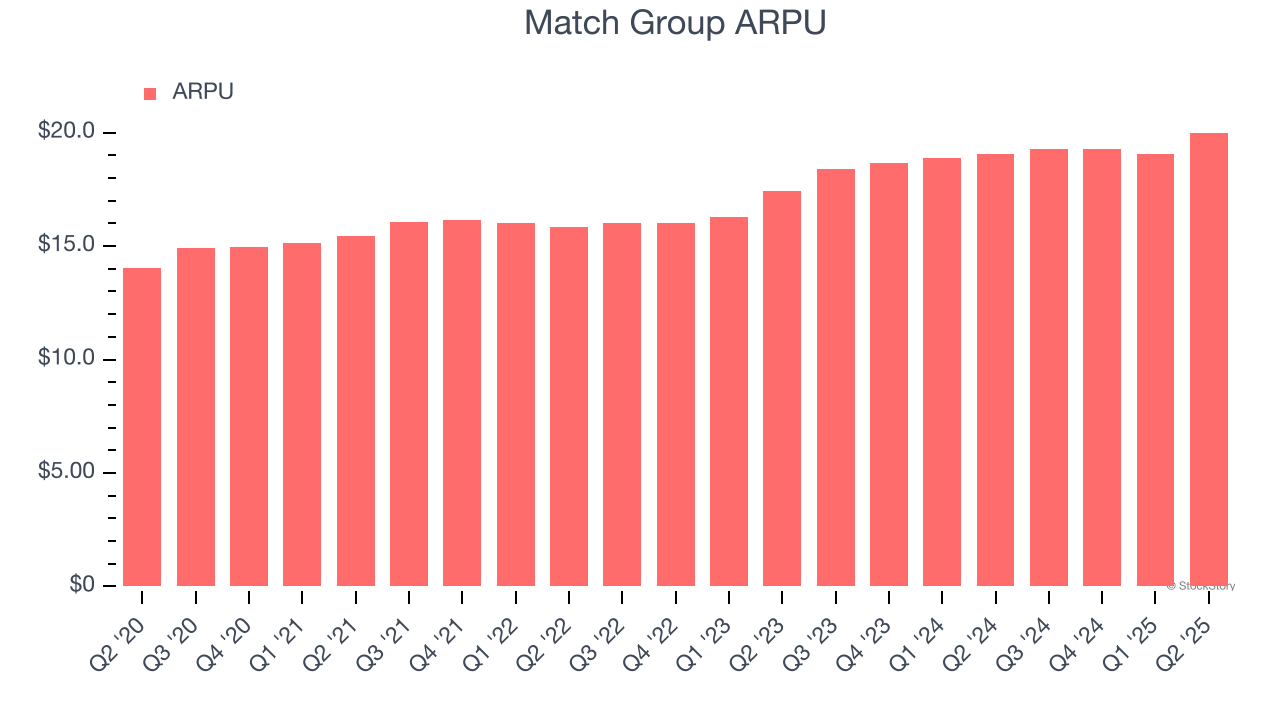
This quarter, Match Group’s ARPU clocked in at $20. It grew by 5% year on year, faster than its payers.
Key Takeaways from Match Group’s Q2 Results
It was encouraging to see Match Group’s revenue guidance for next quarter beat analysts’ expectations. We were also happy its revenue narrowly outperformed Wall Street’s estimates. On the other hand, its number of payers slightly missed and its number of users declined. Overall, this quarter was mixed, but expectations for Match Group are low after a few bad quarters. The stock traded up 9.4% to $36.90 immediately following the results.
Is Match Group an attractive investment opportunity at the current price? What happened in the latest quarter matters, but not as much as longer-term business quality and valuation, when deciding whether to invest in this stock. We cover that in our actionable full research report which you can read here, it’s free.