
Online education Stride (NYSE: LRN) beat Wall Street’s revenue expectations in Q2 CY2025, with sales up 22.4% year on year to $653.6 million. Its non-GAAP profit of $2.29 per share was 21.4% above analysts’ consensus estimates.
Is now the time to buy Stride? Find out by accessing our full research report, it’s free.
Stride (LRN) Q2 CY2025 Highlights:
- Revenue: $653.6 million vs analyst estimates of $627.5 million (22.4% year-on-year growth, 4.2% beat)
- Adjusted EPS: $2.29 vs analyst estimates of $1.89 (21.4% beat)
- Adjusted EBITDA: $158.4 million vs analyst estimates of $149.5 million (24.2% margin, 6% beat)
- Operating Margin: 8.7%, down from 13.8% in the same quarter last year
- Free Cash Flow Margin: 46.7%, up from 29.2% in the same quarter last year
- Market Capitalization: $5.59 billion
Company Overview
Formerly known as K12, Stride (NYSE: LRN) is an education technology company providing education solutions through digital platforms.
Revenue Growth
A company’s long-term sales performance can indicate its overall quality. Any business can put up a good quarter or two, but many enduring ones grow for years.
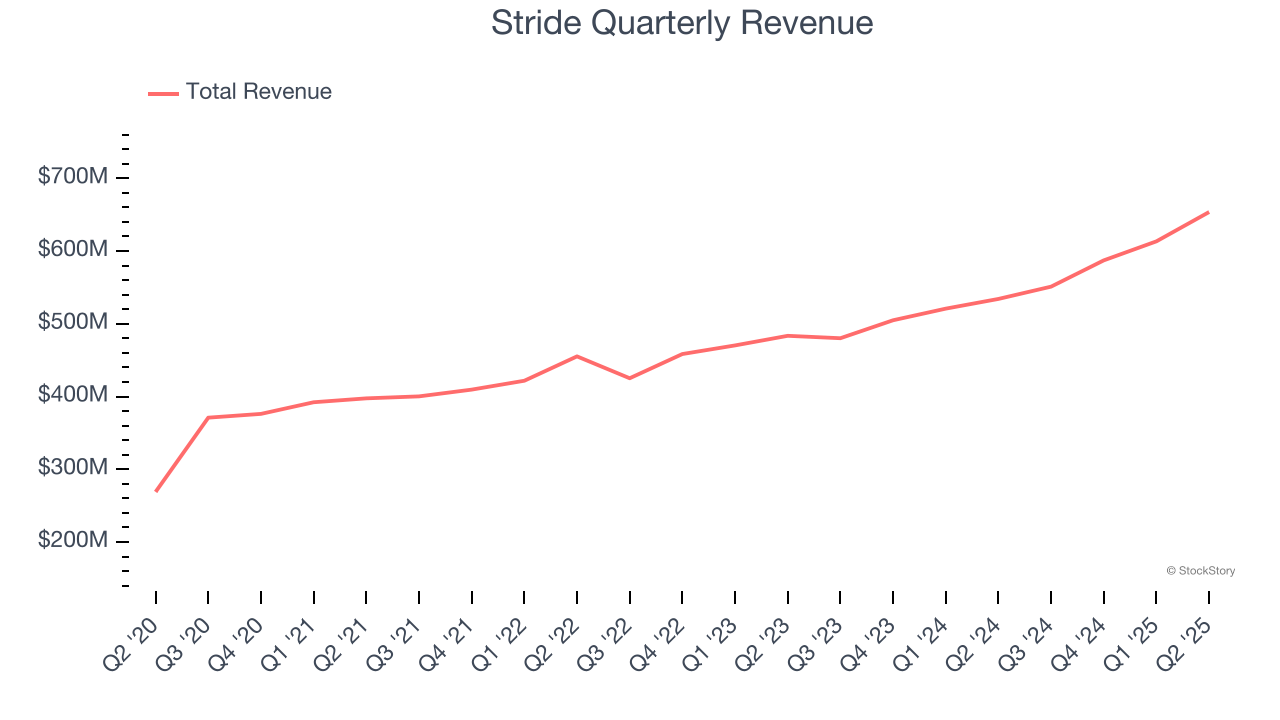
With $2.41 billion in revenue over the past 12 months, Stride is a mid-sized business services company, which sometimes brings disadvantages compared to larger competitors benefiting from better economies of scale. On the bright side, it can still flex high growth rates because it’s working from a smaller revenue base.
As you can see below, Stride’s 18.2% annualized revenue growth over the last five years was incredible. This is a great starting point for our analysis because it shows Stride’s demand was higher than many business services companies.
Long-term growth is the most important, but within business services, a half-decade historical view may miss new innovations or demand cycles. Stride’s annualized revenue growth of 14.4% over the last two years is below its five-year trend, but we still think the results suggest healthy demand. 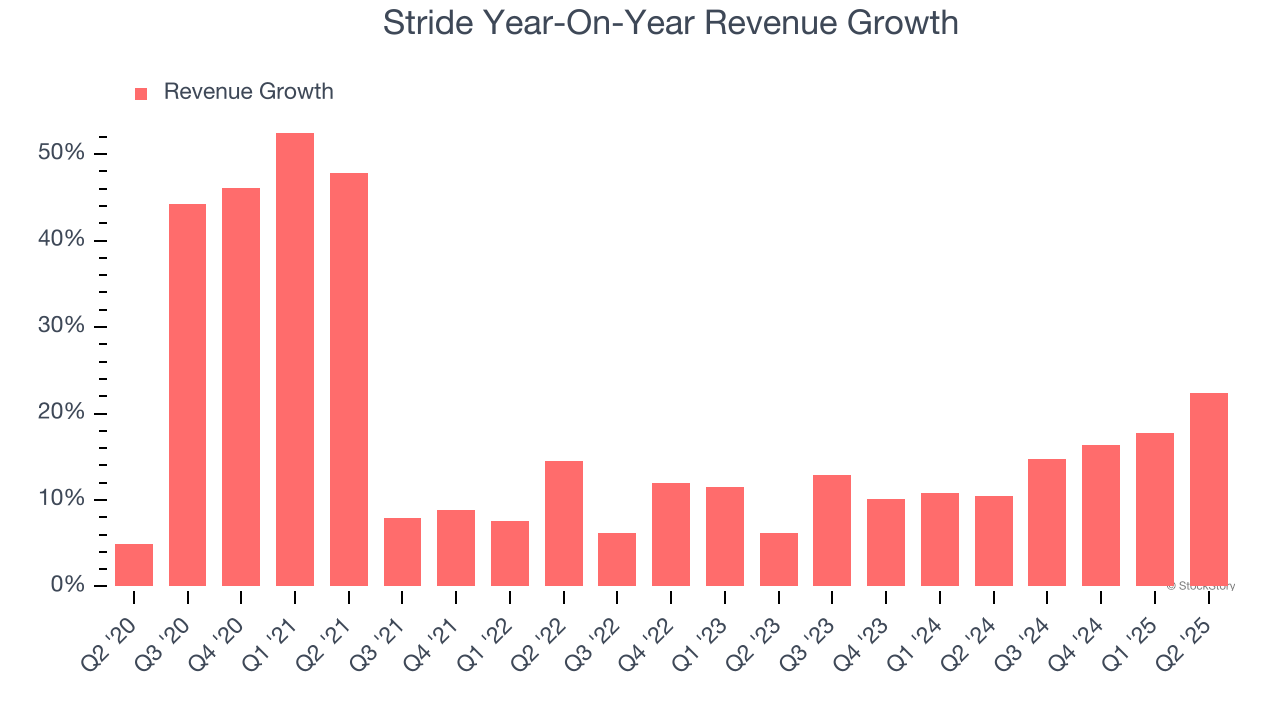
This quarter, Stride reported robust year-on-year revenue growth of 22.4%, and its $653.6 million of revenue topped Wall Street estimates by 4.2%.
Looking ahead, sell-side analysts expect revenue to grow 7% over the next 12 months, a deceleration versus the last two years. Despite the slowdown, this projection is above average for the sector and indicates the market is forecasting some success for its newer products and services.
Here at StockStory, we certainly understand the potential of thematic investing. Diverse winners from Microsoft (MSFT) to Alphabet (GOOG), Coca-Cola (KO) to Monster Beverage (MNST) could all have been identified as promising growth stories with a megatrend driving the growth. So, in that spirit, we’ve identified a relatively under-the-radar profitable growth stock benefiting from the rise of AI, available to you FREE via this link.
Operating Margin
Operating margin is a key measure of profitability. Think of it as net income - the bottom line - excluding the impact of taxes and interest on debt, which are less connected to business fundamentals.
Stride has done a decent job managing its cost base over the last five years. The company has produced an average operating margin of 11%, higher than the broader business services sector.
Analyzing the trend in its profitability, Stride’s operating margin rose by 7.8 percentage points over the last five years, as its sales growth gave it immense operating leverage.
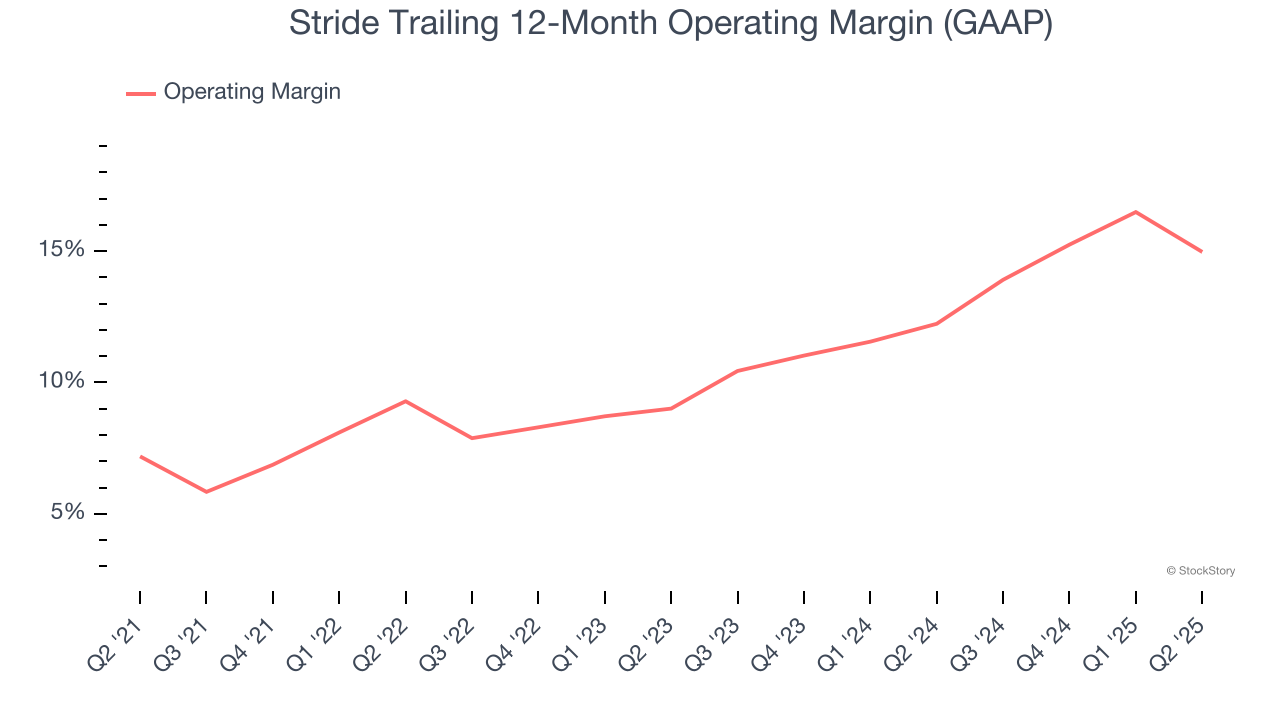
This quarter, Stride generated an operating margin profit margin of 8.7%, down 5.1 percentage points year on year. This contraction shows it was less efficient because its expenses grew faster than its revenue.
Earnings Per Share
Revenue trends explain a company’s historical growth, but the long-term change in earnings per share (EPS) points to the profitability of that growth – for example, a company could inflate its sales through excessive spending on advertising and promotions.
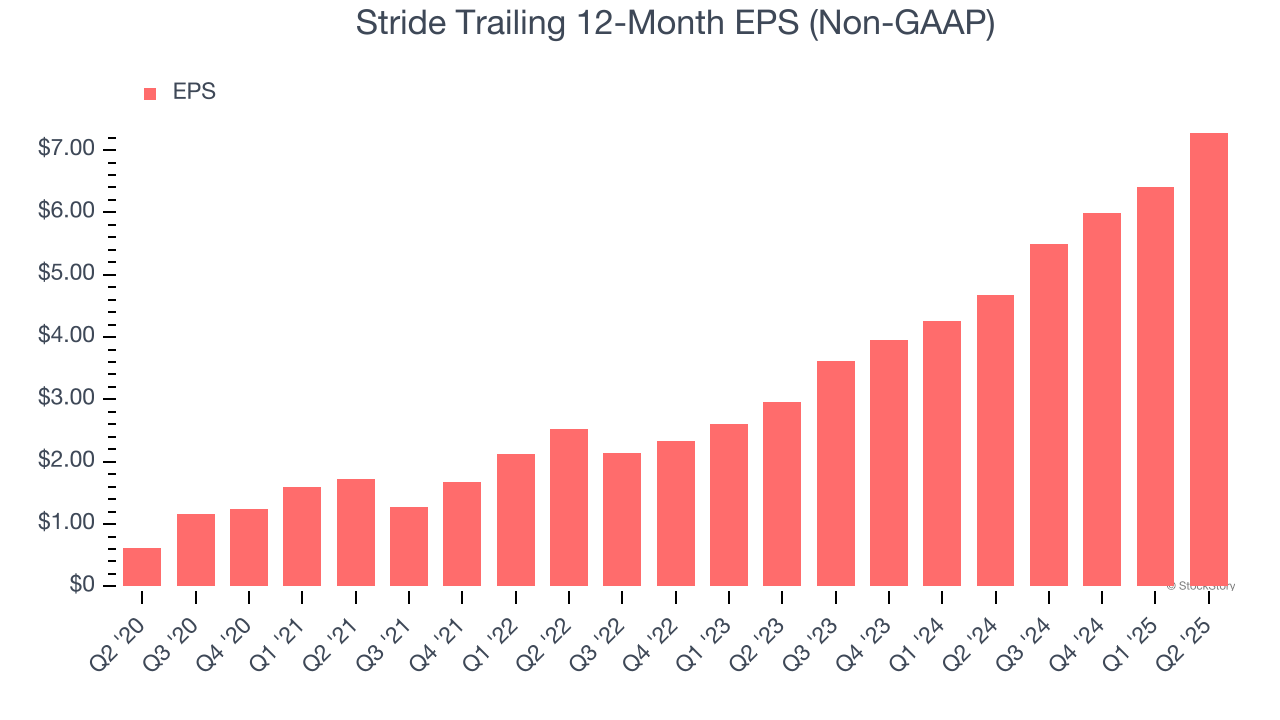
Stride’s EPS grew at an astounding 64.2% compounded annual growth rate over the last five years, higher than its 18.2% annualized revenue growth. This tells us the company became more profitable on a per-share basis as it expanded.
Diving into the nuances of Stride’s earnings can give us a better understanding of its performance. As we mentioned earlier, Stride’s operating margin declined this quarter but expanded by 7.8 percentage points over the last five years. This was the most relevant factor (aside from the revenue impact) behind its higher earnings; interest expenses and taxes can also affect EPS but don’t tell us as much about a company’s fundamentals.
Like with revenue, we analyze EPS over a shorter period to see if we are missing a change in the business.
For Stride, its two-year annual EPS growth of 56.8% was lower than its five-year trend. We still think its growth was good and hope it can accelerate in the future.
In Q2, Stride reported adjusted EPS at $2.29, up from $1.42 in the same quarter last year. This print easily cleared analysts’ estimates, and shareholders should be content with the results. Over the next 12 months, Wall Street expects Stride’s full-year EPS of $7.28 to grow 7.8%.
Key Takeaways from Stride’s Q2 Results
We were impressed by how significantly Stride blew past analysts’ EPS expectations this quarter. We were also glad its revenue outperformed Wall Street’s estimates. Zooming out, we think this quarter featured some important positives. The stock traded up 10.7% to $142.10 immediately after reporting.
Sure, Stride had a solid quarter, but if we look at the bigger picture, is this stock a buy? What happened in the latest quarter matters, but not as much as longer-term business quality and valuation, when deciding whether to invest in this stock. We cover that in our actionable full research report which you can read here, it’s free.