
Senior living provider Brookdale Senior Living (NYSE: BKD) fell short of the market’s revenue expectations in Q2 CY2025 as sales rose 4.6% year on year to $812.9 million. Its GAAP loss of $0.18 per share was 31.9% below analysts’ consensus estimates.
Is now the time to buy Brookdale? Find out by accessing our full research report, it’s free.
Brookdale (BKD) Q2 CY2025 Highlights:
- Revenue: $812.9 million vs analyst estimates of $817.6 million (4.6% year-on-year growth, 0.6% miss)
- EPS (GAAP): -$0.18 vs analyst expectations of -$0.14 (31.9% miss)
- Adjusted EBITDA: $117.1 million vs analyst estimates of $115.2 million (14.4% margin, 1.6% beat)
- EBITDA guidance for the full year is $450 million at the midpoint, in line with analyst expectations
- Operating Margin: 1.8%, in line with the same quarter last year
- Free Cash Flow Margin: 3.6%, up from 0.5% in the same quarter last year
- Market Capitalization: $1.83 billion
"As a result of our continued operational execution and strong occupancy performance, we were able to raise our annual guidance ranges for a second consecutive quarter," said Denise Warren, Brookdale's Interim Chief Executive Officer and Chairman.
Company Overview
With a network of over 650 communities serving approximately 59,000 residents across 41 states, Brookdale Senior Living (NYSE: BKD) operates senior living communities across the United States, offering independent living, assisted living, memory care, and continuing care retirement communities.
Revenue Growth
Examining a company’s long-term performance can provide clues about its quality. Any business can experience short-term success, but top-performing ones enjoy sustained growth for years. Over the last five years, Brookdale’s demand was weak and its revenue declined by 3.8% per year. This was below our standards and suggests it’s a low quality business.
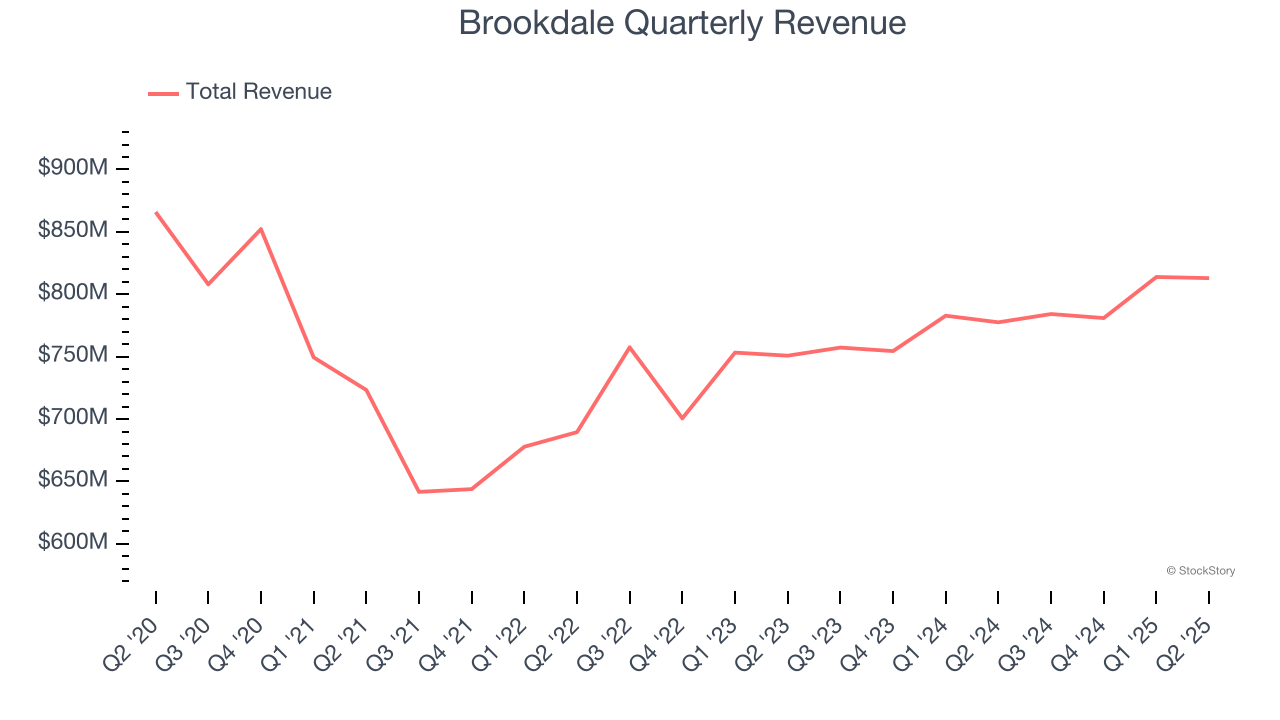
Long-term growth is the most important, but within healthcare, a half-decade historical view may miss new innovations or demand cycles. Brookdale’s annualized revenue growth of 3.8% over the last two years is above its five-year trend, but we were still disappointed by the results. 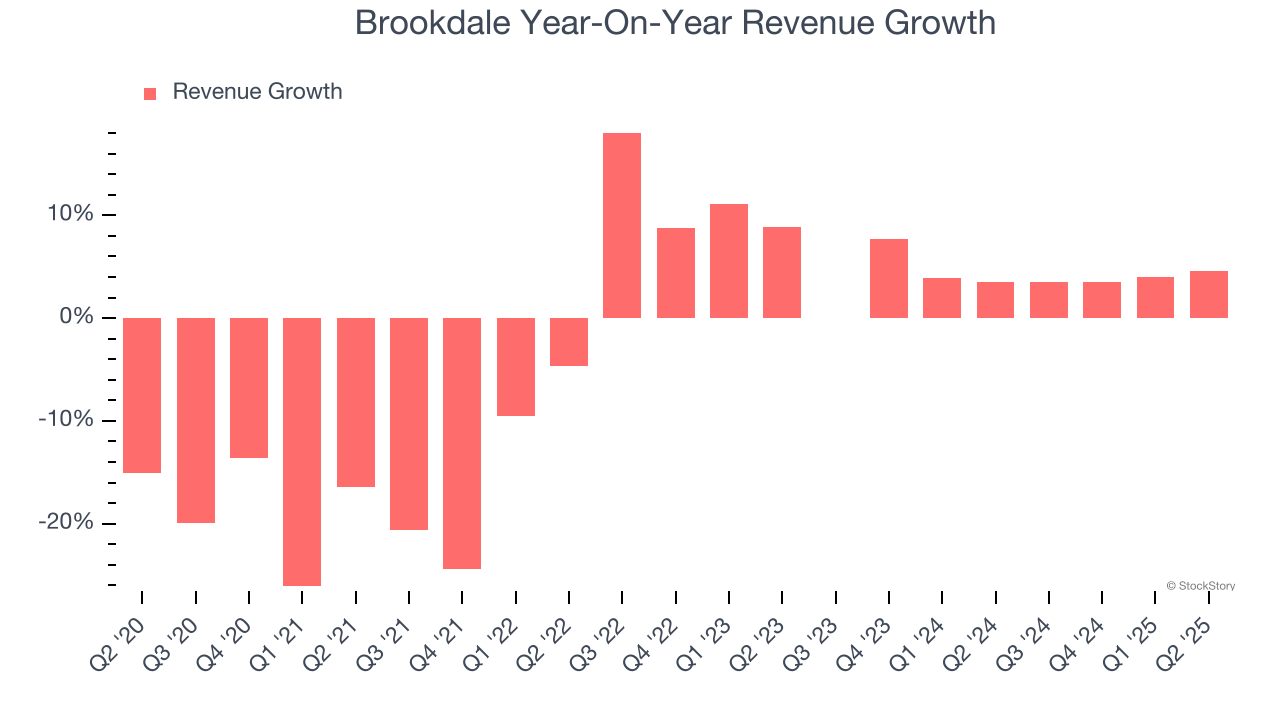
This quarter, Brookdale’s revenue grew by 4.6% year on year to $812.9 million, falling short of Wall Street’s estimates.
Looking ahead, sell-side analysts expect revenue to decline by 2.6% over the next 12 months, a deceleration versus the last two years. This projection is underwhelming and implies its products and services will face some demand challenges.
Here at StockStory, we certainly understand the potential of thematic investing. Diverse winners from Microsoft (MSFT) to Alphabet (GOOG), Coca-Cola (KO) to Monster Beverage (MNST) could all have been identified as promising growth stories with a megatrend driving the growth. So, in that spirit, we’ve identified a relatively under-the-radar profitable growth stock benefiting from the rise of AI, available to you FREE via this link.
Operating Margin
Operating margin is a key measure of profitability. Think of it as net income - the bottom line - excluding the impact of taxes and interest on debt, which are less connected to business fundamentals.
Brookdale was roughly breakeven when averaging the last five years of quarterly operating profits, lousy for a healthcare business.
On the plus side, Brookdale’s operating margin rose by 6.8 percentage points over the last five years. Zooming into its more recent performance, however, we can see the company’s margin has decreased by 1.9 percentage points on a two-year basis. If Brookdale wants to pass our bar, it must prove it can expand its profitability consistently.
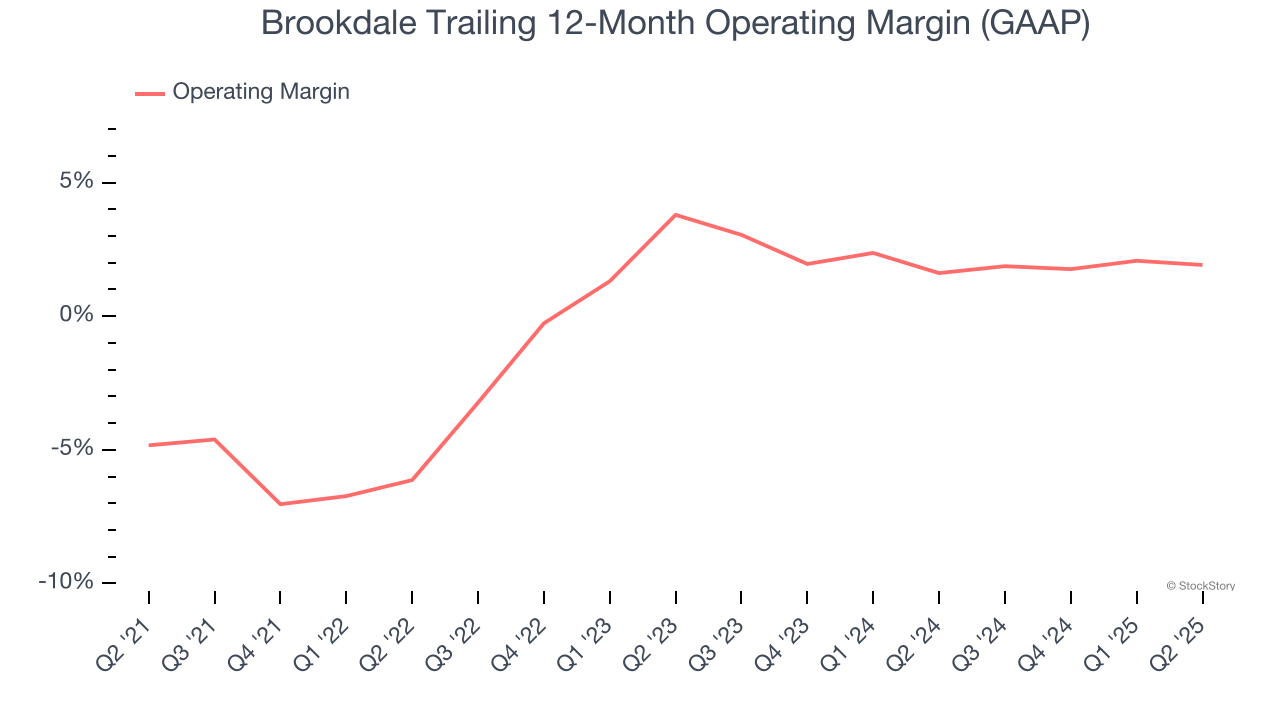
This quarter, Brookdale generated an operating margin profit margin of 1.8%, in line with the same quarter last year. This indicates the company’s overall cost structure has been relatively stable.
Earnings Per Share
We track the long-term change in earnings per share (EPS) for the same reason as long-term revenue growth. Compared to revenue, however, EPS highlights whether a company’s growth is profitable.
Sadly for Brookdale, its EPS declined by 34.4% annually over the last five years, more than its revenue. However, its operating margin actually improved during this time, telling us that non-fundamental factors such as interest expenses and taxes affected its ultimate earnings.
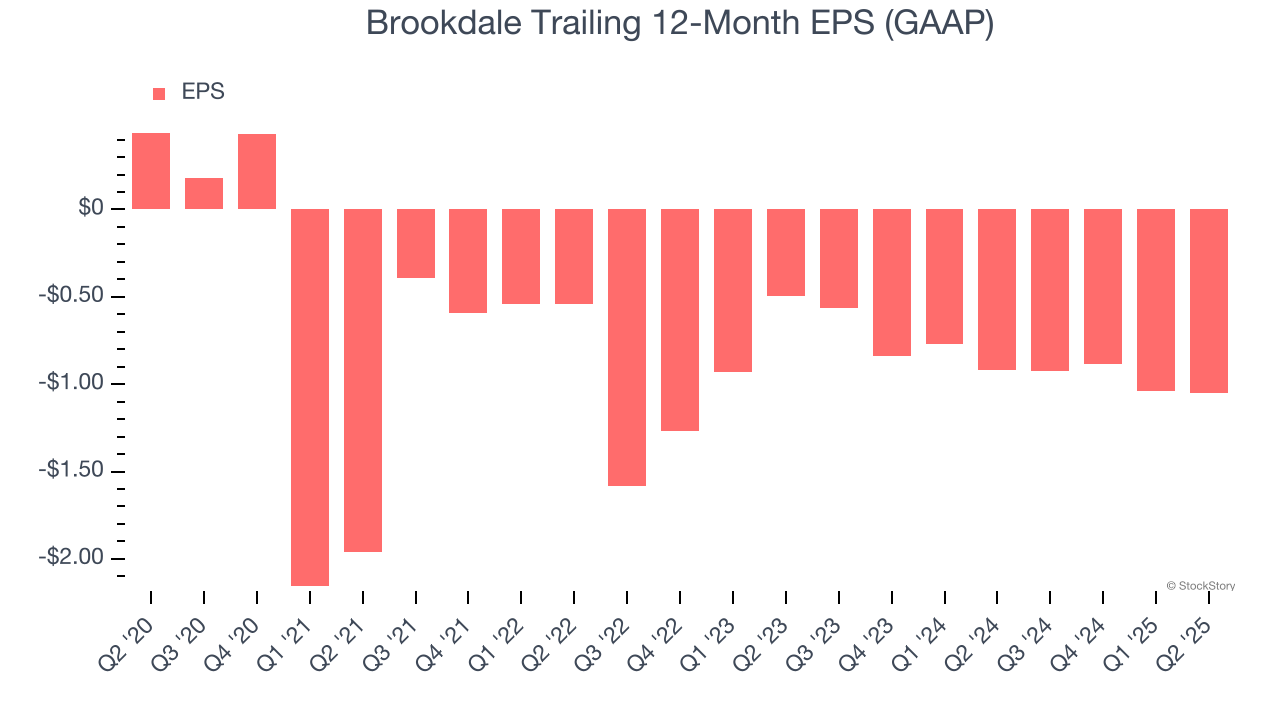
Diving into the nuances of Brookdale’s earnings can give us a better understanding of its performance. A five-year view shows Brookdale has diluted its shareholders, growing its share count by 28.1%. This dilution overshadowed its increased operating efficiency and has led to lower per share earnings. Taxes and interest expenses can also affect EPS but don’t tell us as much about a company’s fundamentals. 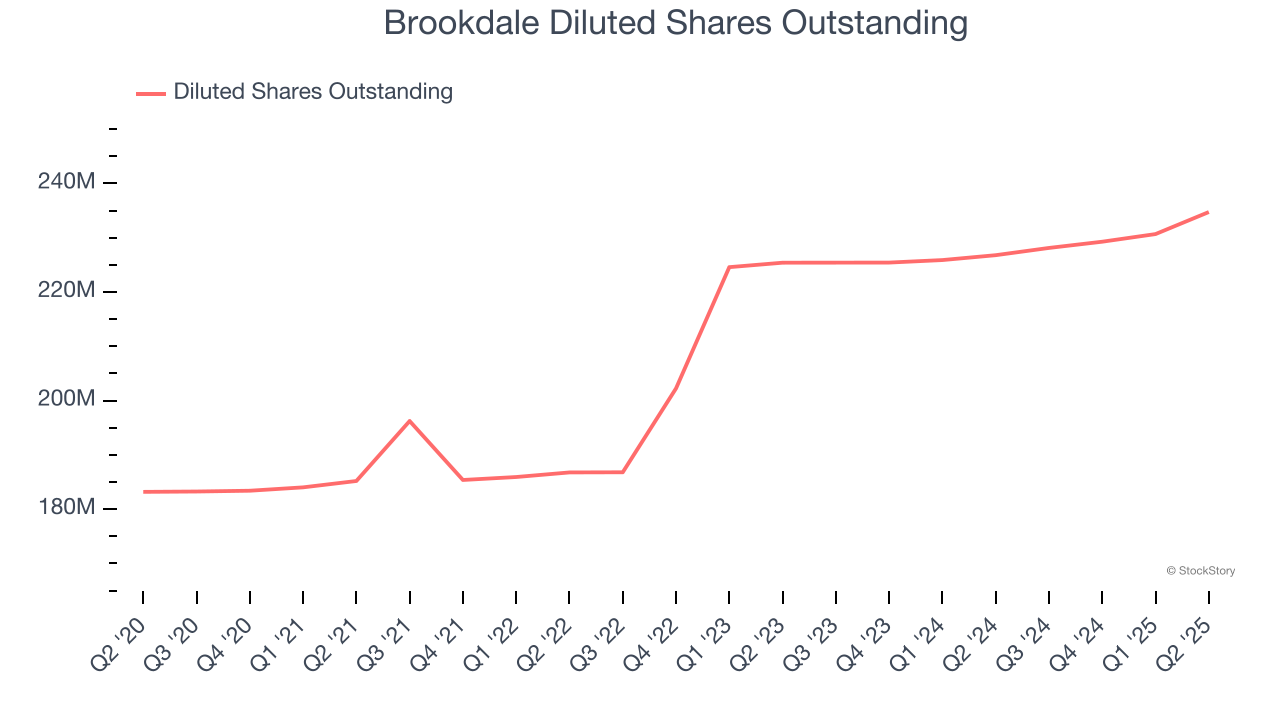
In Q2, Brookdale reported EPS at negative $0.18, down from negative $0.17 in the same quarter last year. This print missed analysts’ estimates. Over the next 12 months, Wall Street expects Brookdale to improve its earnings losses. Analysts forecast its full-year EPS of negative $1.05 will advance to negative $0.50.
Key Takeaways from Brookdale’s Q2 Results
Revenue missed, but the company managed to beat on EBITDA. Looking ahead, EBITDA guidance was in line with Consensus. Overall, this was a mixed quarter. The stock remained flat at $7.80 immediately after reporting.
Big picture, is Brookdale a buy here and now? When making that decision, it’s important to consider its valuation, business qualities, as well as what has happened in the latest quarter. We cover that in our actionable full research report which you can read here, it’s free.