Banking and retail technology provider Diebold Nixdorf (NYSE: DBD) announced better-than-expected revenue in Q2 CY2025, but sales fell by 2.6% year on year to $915.2 million. Its GAAP profit of $0.33 per share was 17.5% below analysts’ consensus estimates.
Is now the time to buy Diebold Nixdorf? Find out by accessing our full research report, it’s free.
Diebold Nixdorf (DBD) Q2 CY2025 Highlights:
- Revenue: $915.2 million vs analyst estimates of $886.1 million (2.6% year-on-year decline, 3.3% beat)
- EPS (GAAP): $0.33 vs analyst expectations of $0.40 (17.5% miss)
- Adjusted EBITDA: $111.2 million vs analyst estimates of $98.9 million (12.2% margin, 12.4% beat)
- EBITDA guidance for the full year is $480 million at the midpoint, in line with analyst expectations
- Operating Margin: 6.1%, down from 7.5% in the same quarter last year
- Free Cash Flow was $12.6 million, up from -$16.1 million in the same quarter last year
- Market Capitalization: $2.09 billion
Company Overview
With roots dating back to 1859 and a presence in over 100 countries, Diebold Nixdorf (NYSE: DBD) provides automated self-service technology, software, and services that help banks and retailers digitize their customer transactions.
Revenue Growth
A company’s long-term performance is an indicator of its overall quality. Any business can experience short-term success, but top-performing ones enjoy sustained growth for years.
With $3.67 billion in revenue over the past 12 months, Diebold Nixdorf is a mid-sized business services company, which sometimes brings disadvantages compared to larger competitors benefiting from better economies of scale.
As you can see below, Diebold Nixdorf struggled to generate demand over the last five years. Its sales dropped by 1.8% annually, a rough starting point for our analysis.
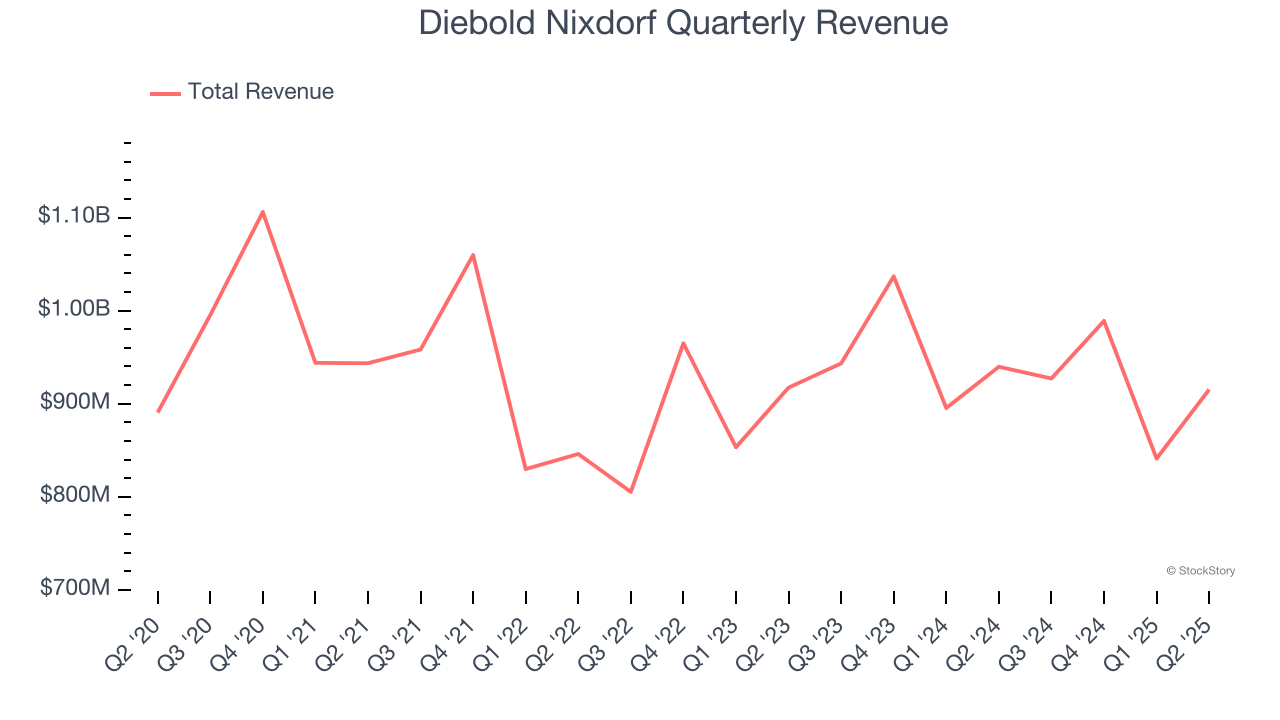
Long-term growth is the most important, but within business services, a half-decade historical view may miss new innovations or demand cycles. Diebold Nixdorf’s annualized revenue growth of 1.8% over the last two years is above its five-year trend, but we were still disappointed by the results. 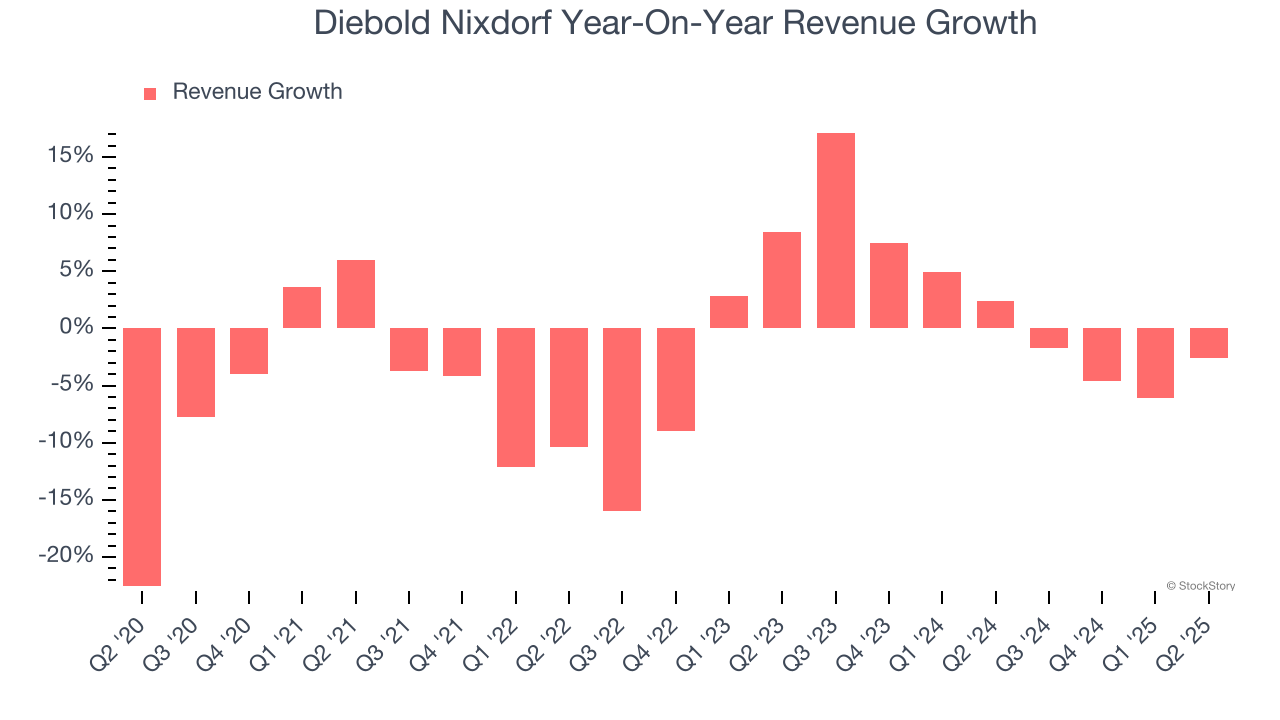
This quarter, Diebold Nixdorf’s revenue fell by 2.6% year on year to $915.2 million but beat Wall Street’s estimates by 3.3%.
Looking ahead, sell-side analysts expect revenue to grow 4.8% over the next 12 months. Although this projection indicates its newer products and services will catalyze better top-line performance, it is still below the sector average.
Software is eating the world and there is virtually no industry left that has been untouched by it. That drives increasing demand for tools helping software developers do their jobs, whether it be monitoring critical cloud infrastructure, integrating audio and video functionality, or ensuring smooth content streaming. Click here to access a free report on our 3 favorite stocks to play this generational megatrend.
Operating Margin
Operating margin is a key measure of profitability. Think of it as net income - the bottom line - excluding the impact of taxes and interest on debt, which are less connected to business fundamentals.
Diebold Nixdorf was profitable over the last five years but held back by its large cost base. Its average operating margin of 1.8% was weak for a business services business.
On the plus side, Diebold Nixdorf’s operating margin rose by 2.8 percentage points over the last five years.
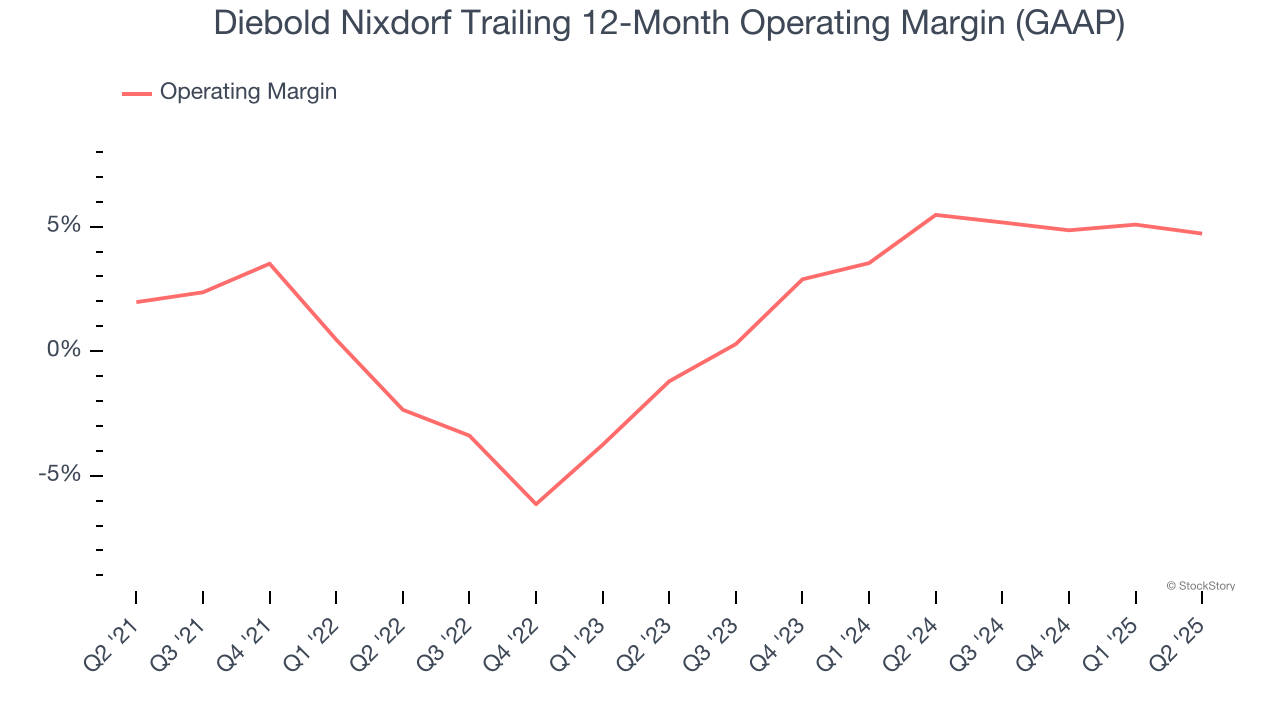
This quarter, Diebold Nixdorf generated an operating margin profit margin of 6.1%, down 1.4 percentage points year on year. This reduction is quite minuscule and indicates the company’s overall cost structure has been relatively stable.
Earnings Per Share
We track the long-term change in earnings per share (EPS) for the same reason as long-term revenue growth. Compared to revenue, however, EPS highlights whether a company’s growth is profitable.
Although Diebold Nixdorf’s full-year earnings are still negative, it reduced its losses and improved its EPS by 35.1% annually over the last five years. The next few quarters will be critical for assessing its long-term profitability.
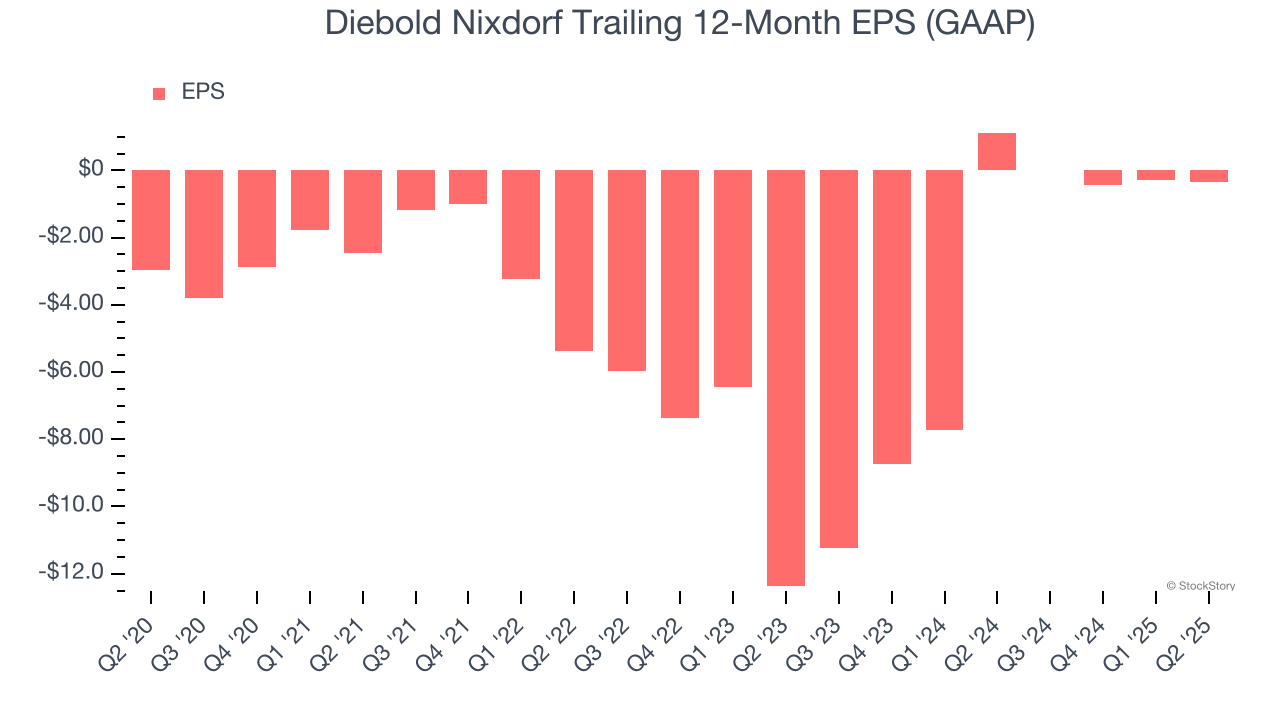
Like with revenue, we analyze EPS over a more recent period because it can provide insight into an emerging theme or development for the business.
For Diebold Nixdorf, its two-year annual EPS growth of 83.4% was higher than its five-year trend. We love it when earnings improve, but a caveat is that its EPS is still in the red.
In Q2, Diebold Nixdorf reported EPS at $0.33, down from $0.40 in the same quarter last year. This print missed analysts’ estimates. Over the next 12 months, Wall Street is optimistic. Analysts forecast Diebold Nixdorf’s full-year EPS of negative $0.34 will flip to positive $3.42.
Key Takeaways from Diebold Nixdorf’s Q2 Results
We enjoyed seeing Diebold Nixdorf beat analysts’ revenue and EBITDA expectations this quarter. On the other hand, its EPS missed. Overall, this was a decent quarter. The stock traded up 5% to $59.10 immediately after reporting.
So should you invest in Diebold Nixdorf right now? What happened in the latest quarter matters, but not as much as longer-term business quality and valuation, when deciding whether to invest in this stock. We cover that in our actionable full research report which you can read here, it’s free.