Global entertainment and media company Disney (NYSE: DIS) met Wall Street’s revenue expectations in Q2 CY2025, with sales up 2.1% year on year to $23.65 billion. Its non-GAAP profit of $1.61 per share was 11.5% above analysts’ consensus estimates.
Is now the time to buy Disney? Find out by accessing our full research report, it’s free.
Disney (DIS) Q2 CY2025 Highlights:
- Revenue: $23.65 billion vs analyst estimates of $23.76 billion (2.1% year-on-year growth, in line)
- Adjusted EPS: $1.61 vs analyst estimates of $1.44 (11.5% beat)
- Adjusted EBITDA: $5.91 billion vs analyst estimates of $5.09 billion (25% margin, 16.1% beat)
- Adjusted EPS guidance for the full year is $5.85 at the midpoint, beating analyst estimates by 1.3%
- Operating Margin: 19.3%, up from 16.8% in the same quarter last year
- Free Cash Flow Margin: 8%, up from 5.3% in the same quarter last year
- Market Capitalization: $212.7 billion
“We are pleased with our creative success and financial performance in Q3 as we continue to execute across our strategic priorities,” said Robert A. Iger, Chief Executive Officer, The Walt Disney Company.
Company Overview
Founded by brothers Walt and Roy, Disney (NYSE: DIS) is a multinational entertainment conglomerate, renowned for its theme parks, movies, television networks, and merchandise.
Revenue Growth
A company’s long-term performance is an indicator of its overall quality. Any business can experience short-term success, but top-performing ones enjoy sustained growth for years. Unfortunately, Disney’s 6.3% annualized revenue growth over the last five years was sluggish. This fell short of our benchmark for the consumer discretionary sector and is a poor baseline for our analysis.
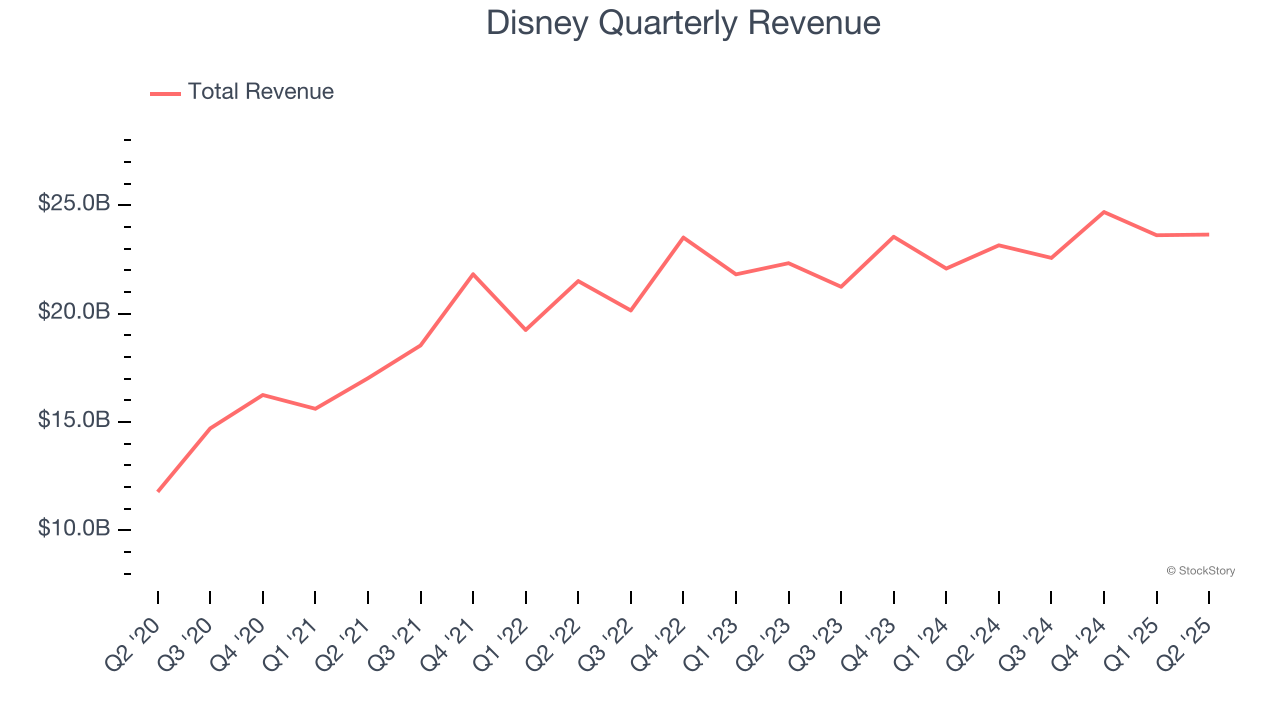
Long-term growth is the most important, but within consumer discretionary, product cycles are short and revenue can be hit-driven due to rapidly changing trends and consumer preferences. Disney’s recent performance shows its demand has slowed as its annualized revenue growth of 3.8% over the last two years was below its five-year trend. 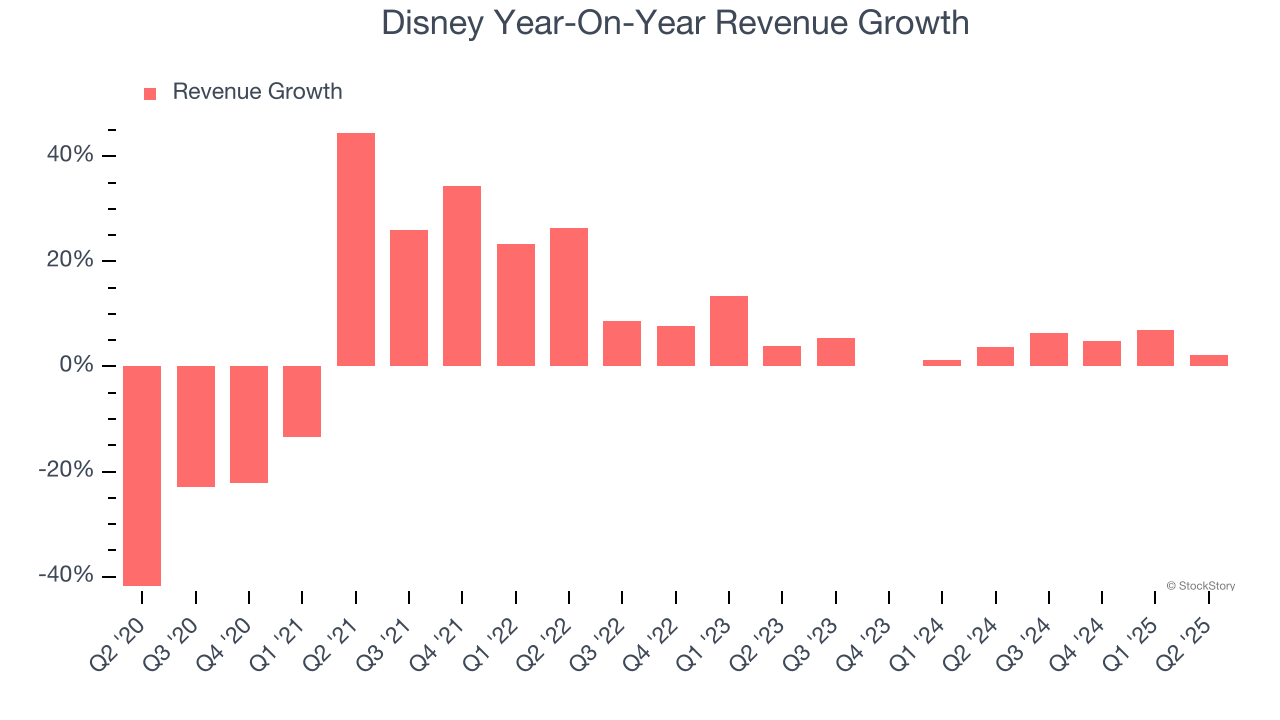
Disney also breaks out the revenue for its three most important segments: Entertainment, Sports, and Experiences, which are 45.3%, 18.2%, and 38.4% of revenue. Over the last two years, Disney’s revenues in all three segments increased. Its Entertainment revenue (movies, Disney+) averaged year-on-year growth of 3.5% while its Sports (ESPN, SEC Network) and Experiences (theme parks) revenues averaged 1.5% and 6.2%. 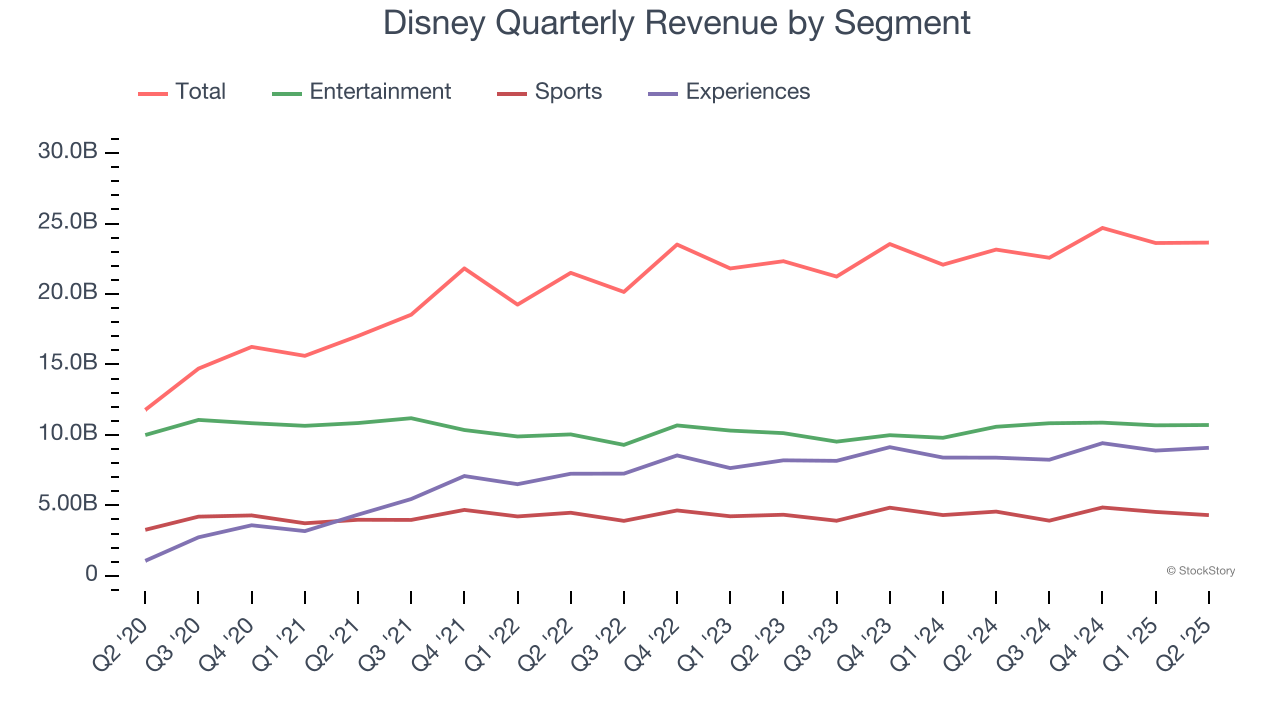
This quarter, Disney grew its revenue by 2.1% year on year, and its $23.65 billion of revenue was in line with Wall Street’s estimates.
Looking ahead, sell-side analysts expect revenue to grow 5% over the next 12 months, similar to its two-year rate. While this projection indicates its newer products and services will spur better top-line performance, it is still below average for the sector.
Today’s young investors won’t have read the timeless lessons in Gorilla Game: Picking Winners In High Technology because it was written more than 20 years ago when Microsoft and Apple were first establishing their supremacy. But if we apply the same principles, then enterprise software stocks leveraging their own generative AI capabilities may well be the Gorillas of the future. So, in that spirit, we are excited to present our Special Free Report on a profitable, fast-growing enterprise software stock that is already riding the automation wave and looking to catch the generative AI next.
Operating Margin
Disney’s operating margin has been trending up over the last 12 months and averaged 15.1% over the last two years. Its solid profitability for a consumer discretionary business shows it’s an efficient company that manages its expenses effectively.
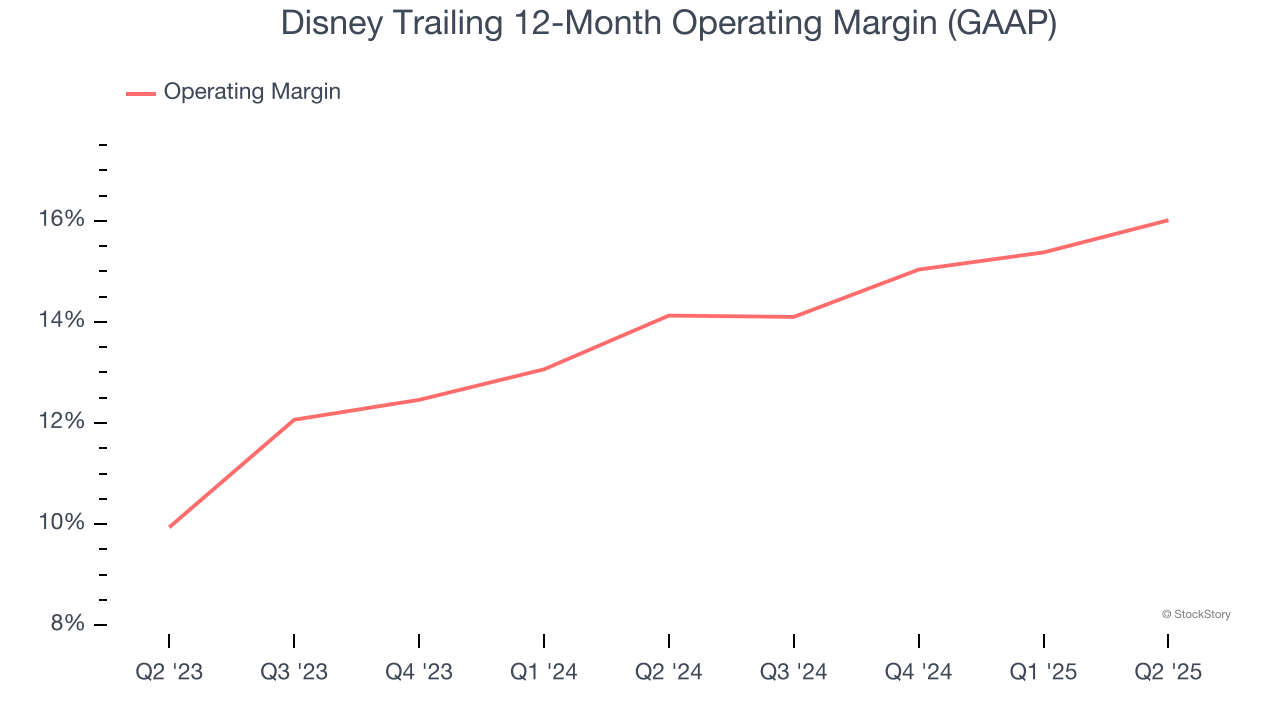
This quarter, Disney generated an operating margin profit margin of 19.3%, up 2.5 percentage points year on year. This increase was a welcome development and shows it was more efficient.
Earnings Per Share
We track the long-term change in earnings per share (EPS) for the same reason as long-term revenue growth. Compared to revenue, however, EPS highlights whether a company’s growth is profitable.
Disney’s EPS grew at a decent 12.7% compounded annual growth rate over the last five years, higher than its 6.3% annualized revenue growth. This tells us the company became more profitable on a per-share basis as it expanded.
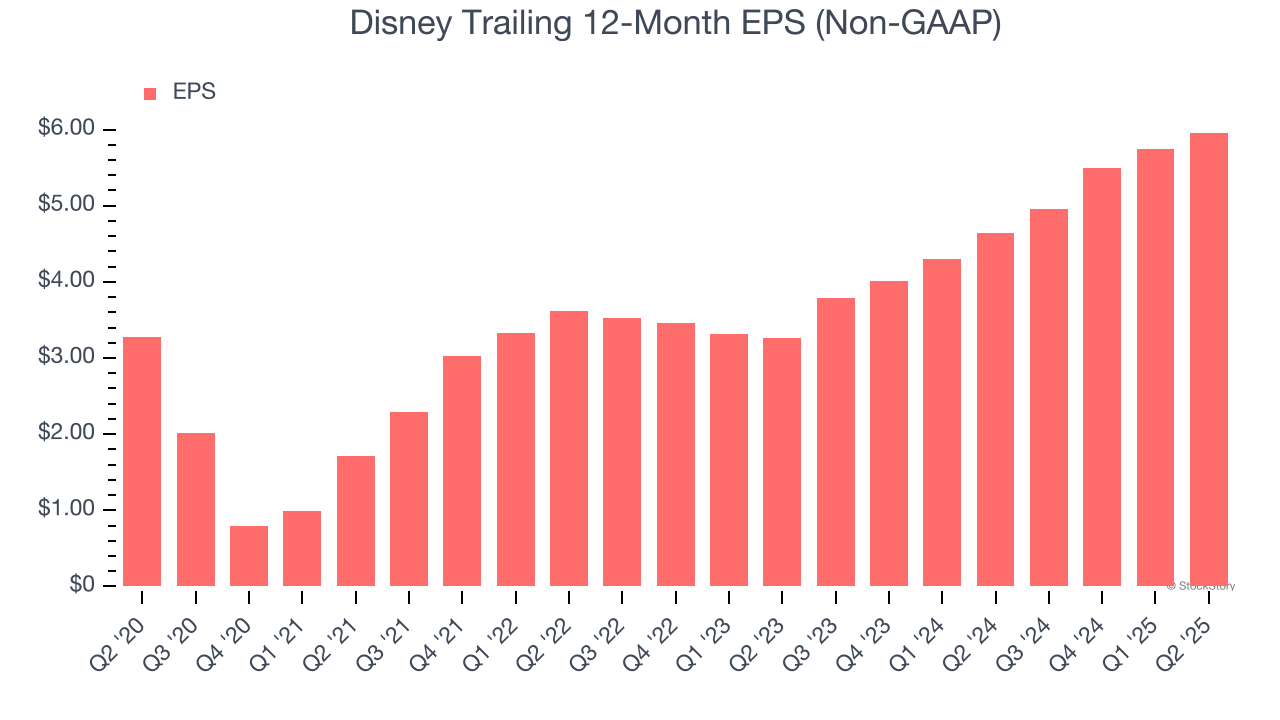
In Q2, Disney reported adjusted EPS at $1.61, up from $1.39 in the same quarter last year. This print easily cleared analysts’ estimates, and shareholders should be content with the results. Over the next 12 months, Wall Street expects Disney’s full-year EPS of $5.96 to stay about the same.
Key Takeaways from Disney’s Q2 Results
We enjoyed seeing Disney beat analysts’ EBITDA expectations this quarter. We were also happy its EPS outperformed Wall Street’s estimates. On the other hand, its Experiences revenue missed and its revenue was in line with Wall Street’s estimates. Overall, this print was mixed. Investors were likely hoping for more, and shares traded down 1.2% to $116.98 immediately after reporting.
So do we think Disney is an attractive buy at the current price? The latest quarter does matter, but not nearly as much as longer-term fundamentals and valuation, when deciding if the stock is a buy. We cover that in our actionable full research report which you can read here, it’s free.