
Radiopharmaceutical company Lantheus Holdings (NASDAQ: LNTH) fell short of the market’s revenue expectations in Q2 CY2025, with sales falling 4.1% year on year to $378 million. The company’s full-year revenue guidance of $1.49 billion at the midpoint came in 5% below analysts’ estimates. Its non-GAAP profit of $1.57 per share was 6.3% below analysts’ consensus estimates.
Is now the time to buy Lantheus? Find out by accessing our full research report, it’s free.
Lantheus (LNTH) Q2 CY2025 Highlights:
- Revenue: $378 million vs analyst estimates of $387.8 million (4.1% year-on-year decline, 2.5% miss)
- Adjusted EPS: $1.57 vs analyst expectations of $1.68 (6.3% miss)
- The company dropped its revenue guidance for the full year to $1.49 billion at the midpoint from $1.57 billion, a 4.8% decrease
- Management lowered its full-year Adjusted EPS guidance to $5.60 at the midpoint, a 15.8% decrease
- Operating Margin: 23.3%, down from 26.1% in the same quarter last year
- Free Cash Flow Margin: 20.9%, up from 18.7% in the same quarter last year
- Market Capitalization: $5.02 billion
“In the second quarter and the month thereafter, we completed the acquisitions of both Evergreen Theragnostics and Life Molecular Imaging – key steps in executing our strategy to expand capabilities across the radiopharmaceutical value chain, diversify revenue, including with Neuraceq, and drive future growth. At the same time, we navigated increased competition in the PSMA PET landscape, which impacted PYLARIFY performance. We are taking actions to reinforce PYLARIFY’s clinical differentiation and support the value of our PSMA PET franchise,” said Brian Markison, CEO.
Company Overview
Pioneering the "Find, Fight and Follow" approach to disease management, Lantheus Holdings (NASDAQGM:LNTH) develops and commercializes radiopharmaceuticals and other imaging agents that help healthcare professionals detect, diagnose, and treat diseases.
Revenue Growth
A company’s long-term sales performance is one signal of its overall quality. Any business can have short-term success, but a top-tier one grows for years. Over the last five years, Lantheus grew its sales at an incredible 35.6% compounded annual growth rate. Its growth beat the average healthcare company and shows its offerings resonate with customers, a helpful starting point for our analysis.
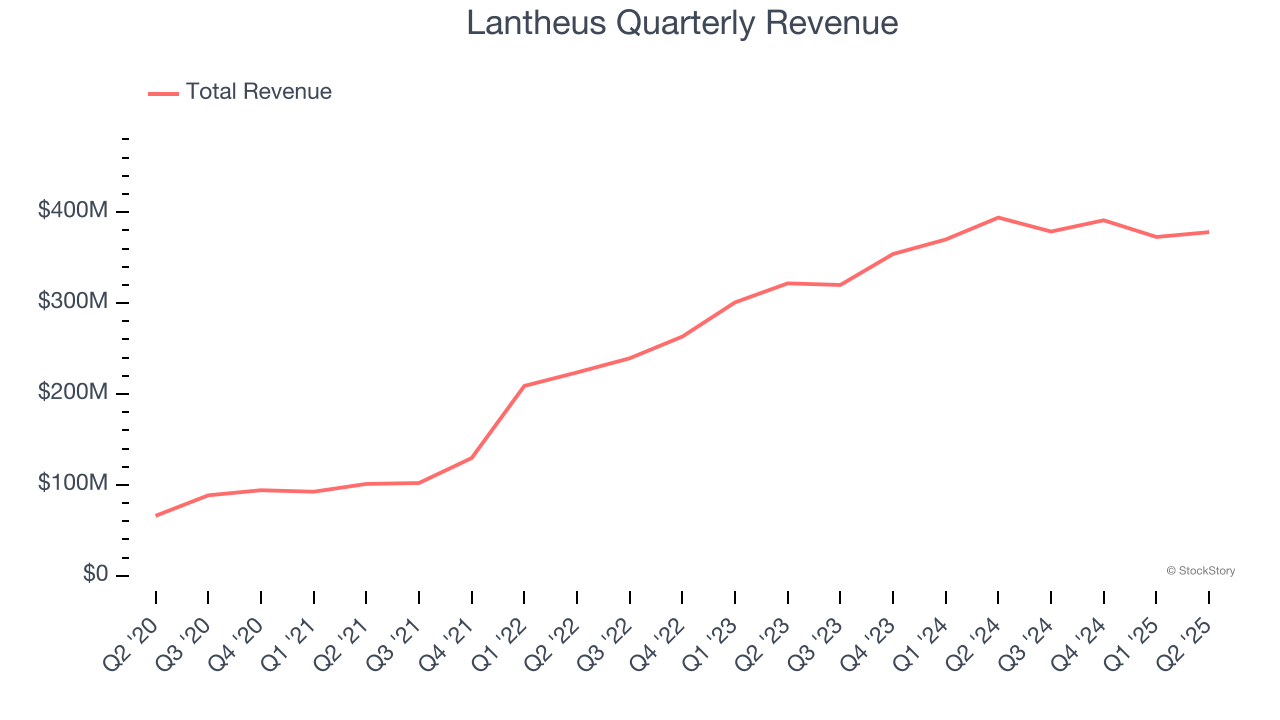
We at StockStory place the most emphasis on long-term growth, but within healthcare, a half-decade historical view may miss recent innovations or disruptive industry trends. Lantheus’s annualized revenue growth of 16.3% over the last two years is below its five-year trend, but we still think the results suggest healthy demand. 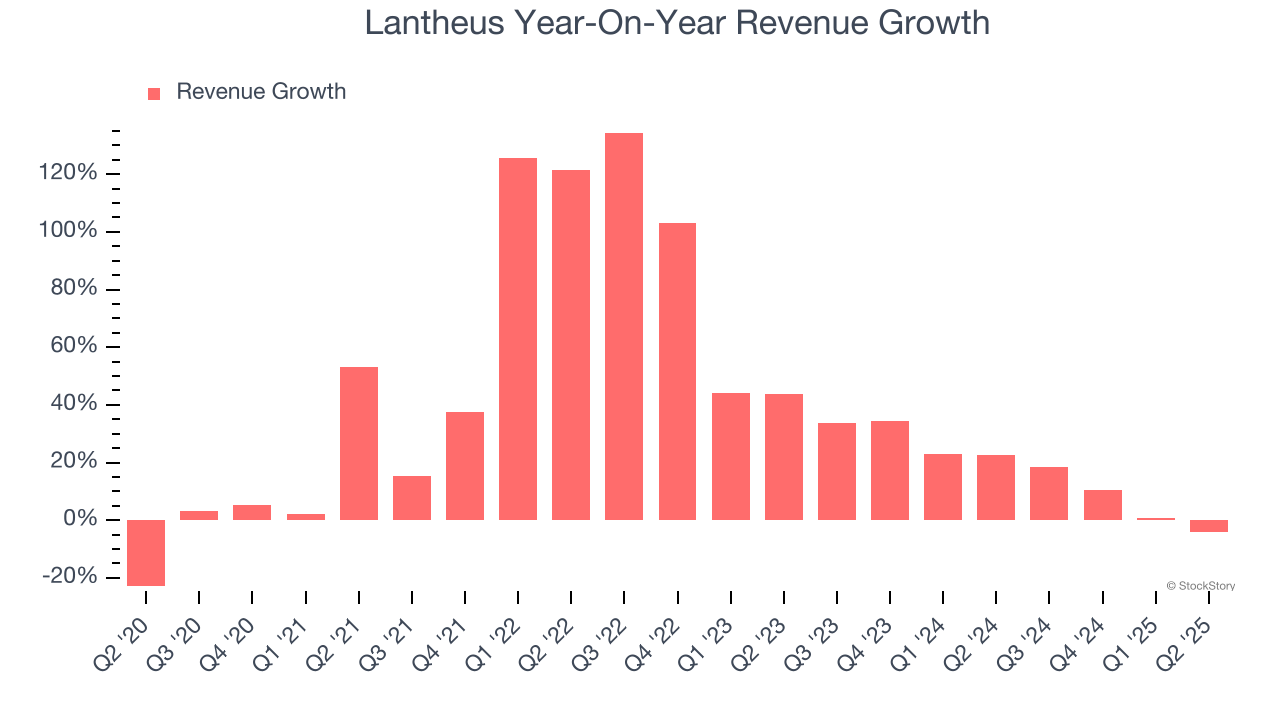
This quarter, Lantheus missed Wall Street’s estimates and reported a rather uninspiring 4.1% year-on-year revenue decline, generating $378 million of revenue.
Looking ahead, sell-side analysts expect revenue to grow 8.6% over the next 12 months, a deceleration versus the last two years. Despite the slowdown, this projection is noteworthy and indicates the market is forecasting success for its products and services.
Today’s young investors won’t have read the timeless lessons in Gorilla Game: Picking Winners In High Technology because it was written more than 20 years ago when Microsoft and Apple were first establishing their supremacy. But if we apply the same principles, then enterprise software stocks leveraging their own generative AI capabilities may well be the Gorillas of the future. So, in that spirit, we are excited to present our Special Free Report on a profitable, fast-growing enterprise software stock that is already riding the automation wave and looking to catch the generative AI next.
Operating Margin
Lantheus has managed its cost base well over the last five years. It demonstrated solid profitability for a healthcare business, producing an average operating margin of 19.1%.
Looking at the trend in its profitability, Lantheus’s operating margin rose by 33.3 percentage points over the last five years, as its sales growth gave it immense operating leverage. Zooming in on its more recent performance, we can see the company’s trajectory is intact as its margin has also increased by 26.2 percentage points on a two-year basis. These data points are very encouraging and show momentum is on its side.
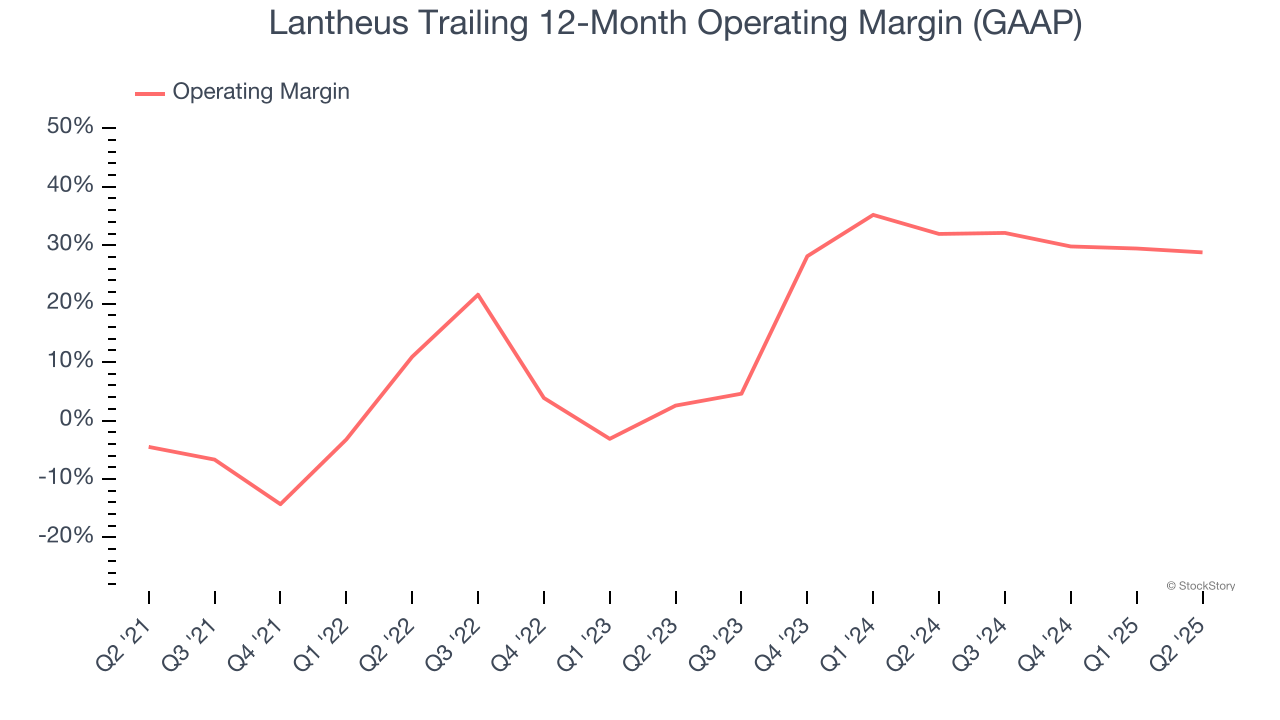
In Q2, Lantheus generated an operating margin profit margin of 23.3%, down 2.8 percentage points year on year. This contraction shows it was less efficient because its expenses increased relative to its revenue.
Earnings Per Share
Revenue trends explain a company’s historical growth, but the long-term change in earnings per share (EPS) points to the profitability of that growth – for example, a company could inflate its sales through excessive spending on advertising and promotions.
Lantheus’s EPS grew at an astounding 42.7% compounded annual growth rate over the last five years, higher than its 35.6% annualized revenue growth. This tells us the company became more profitable on a per-share basis as it expanded.
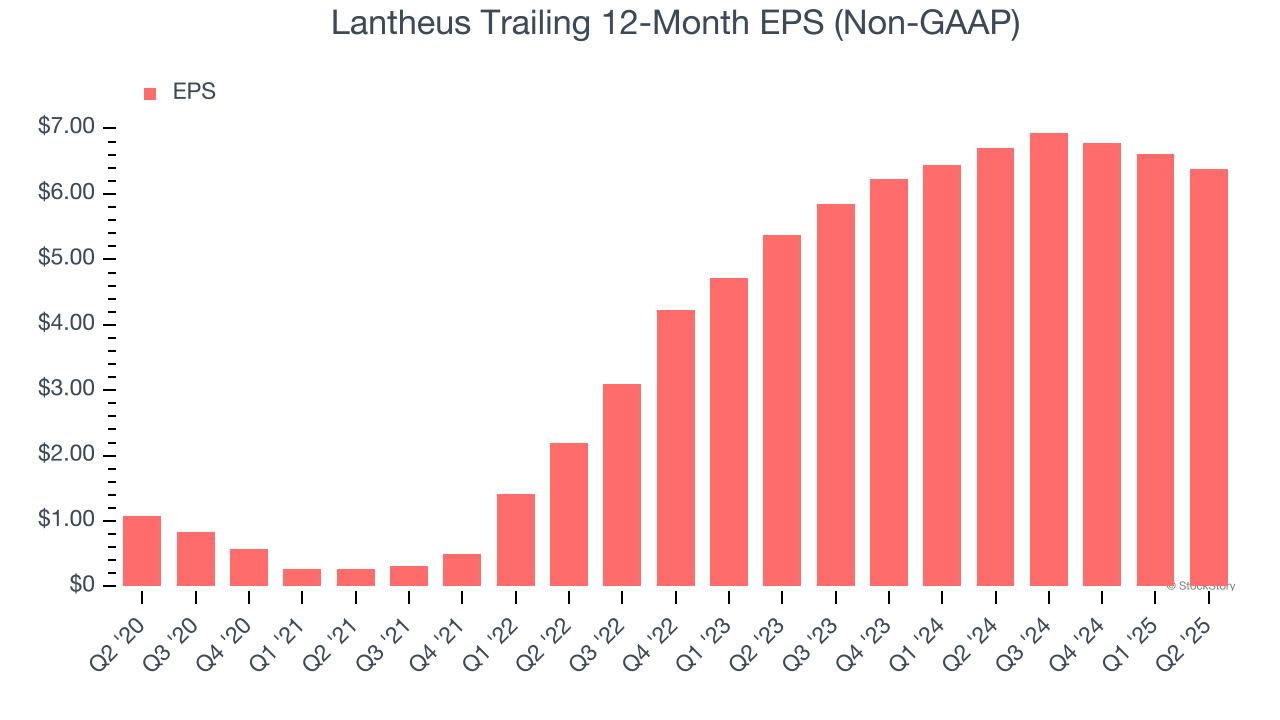
We can take a deeper look into Lantheus’s earnings to better understand the drivers of its performance. As we mentioned earlier, Lantheus’s operating margin declined this quarter but expanded by 33.3 percentage points over the last five years. This was the most relevant factor (aside from the revenue impact) behind its higher earnings; interest expenses and taxes can also affect EPS but don’t tell us as much about a company’s fundamentals.
In Q2, Lantheus reported adjusted EPS at $1.57, down from $1.80 in the same quarter last year. This print missed analysts’ estimates, but we care more about long-term adjusted EPS growth than short-term movements. Over the next 12 months, Wall Street expects Lantheus’s full-year EPS of $6.39 to grow 4.9%.
Key Takeaways from Lantheus’s Q2 Results
We struggled to find many positives in these results. Its full-year revenue guidance missed and its full-year EPS guidance fell short of Wall Street’s estimates. Overall, this quarter was bad. The stock traded down 20.8% to $57.50 immediately following the results.
Lantheus didn’t show it’s best hand this quarter, but does that create an opportunity to buy the stock right now? If you’re making that decision, you should consider the bigger picture of valuation, business qualities, as well as the latest earnings. We cover that in our actionable full research report which you can read here, it’s free.


