
Media broadcasting company Sinclair (NASDAQ: SBGI) fell short of the market’s revenue expectations in Q2 CY2025, with sales falling 5.4% year on year to $784 million. Next quarter’s revenue guidance of $764 million underwhelmed, coming in 3.6% below analysts’ estimates. Its GAAP loss of $0.91 per share was 17% below analysts’ consensus estimates.
Is now the time to buy Sinclair? Find out by accessing our full research report, it’s free.
Sinclair (SBGI) Q2 CY2025 Highlights:
- Revenue: $784 million vs analyst estimates of $801.2 million (5.4% year-on-year decline, 2.2% miss)
- EPS (GAAP): -$0.91 vs analyst expectations of -$0.78 (17% miss)
- Adjusted EBITDA: $103 million vs analyst estimates of $103.7 million (13.1% margin, 0.7% miss)
- Revenue Guidance for Q3 CY2025 is $764 million at the midpoint, below analyst estimates of $792.2 million
- EBITDA guidance for Q3 CY2025 is $82 million at the midpoint, below analyst estimates of $112.7 million
- Operating Margin: 2.7%, down from 7.7% in the same quarter last year
- Market Capitalization: $986.5 million
Company Overview
With over 2,400 hours of local news produced weekly and 640 broadcast channels reaching millions of American homes, Sinclair (NASDAQ: SBGI) operates a network of 185 local television stations across 86 U.S. markets, producing news programming and distributing content from major networks.
Revenue Growth
Reviewing a company’s long-term sales performance reveals insights into its quality. Even a bad business can shine for one or two quarters, but a top-tier one grows for years.
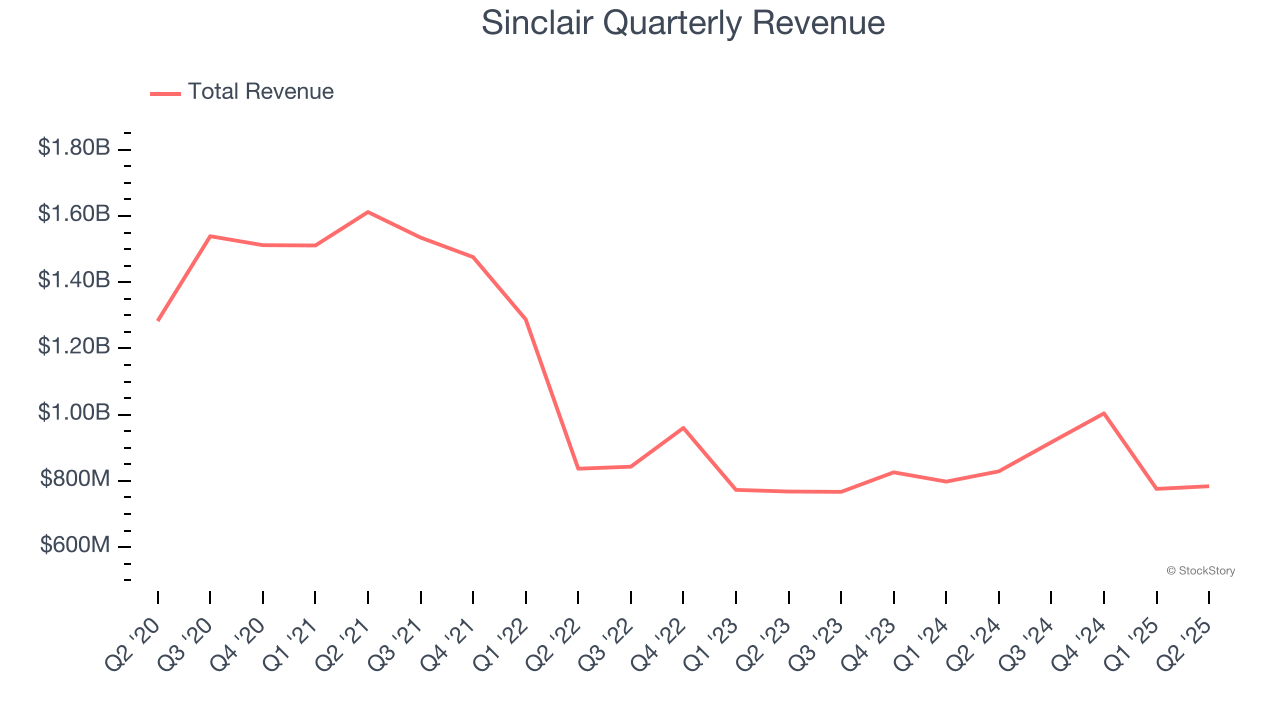
With $3.48 billion in revenue over the past 12 months, Sinclair is a mid-sized business services company, which sometimes brings disadvantages compared to larger competitors benefiting from better economies of scale.
As you can see below, Sinclair’s revenue declined by 9.2% per year over the last five years, a poor baseline for our analysis.
We at StockStory place the most emphasis on long-term growth, but within business services, a half-decade historical view may miss recent innovations or disruptive industry trends. Sinclair’s annualized revenue growth of 2% over the last two years is above its five-year trend, but we were still disappointed by the results. 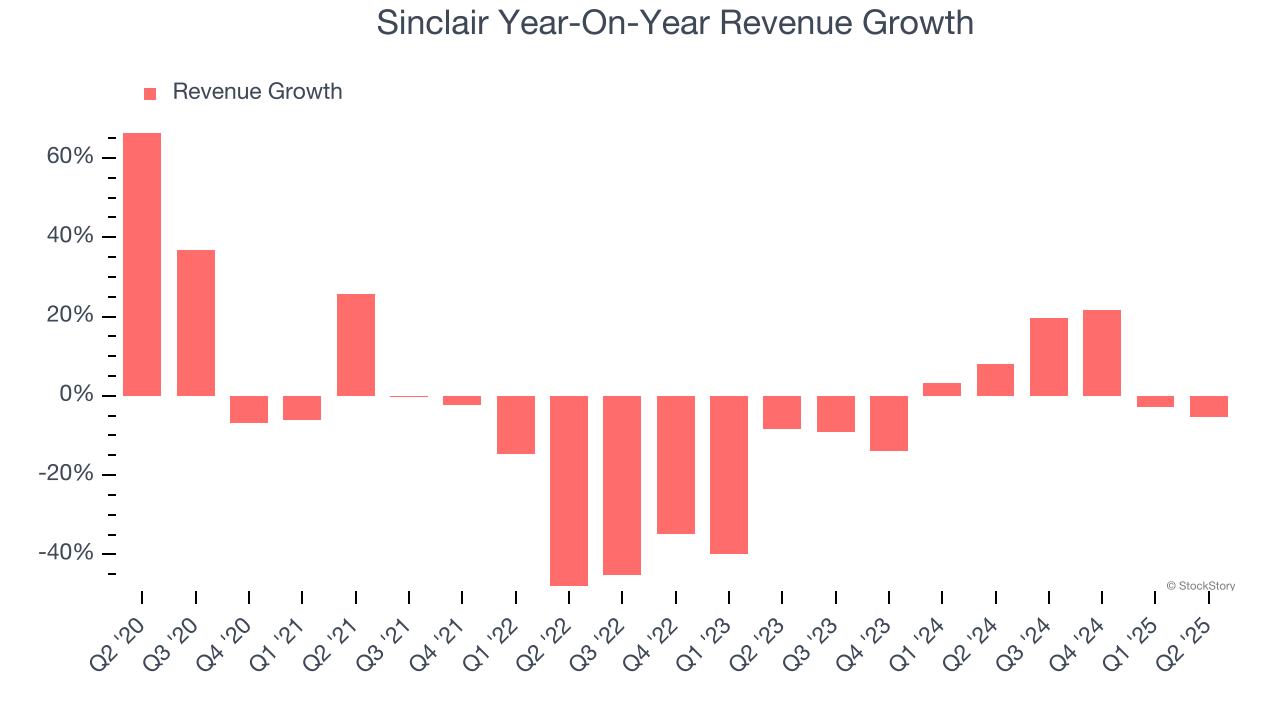
We can better understand the company’s revenue dynamics by analyzing its most important segments, Distribution and Advertising, which are 55.4% and 40.3% of revenue. Over the last two years, Sinclair’s Distribution revenue (content distribution) averaged 2.3% year-on-year growth while its Advertising revenue (advertising sales) averaged 5.2% growth. 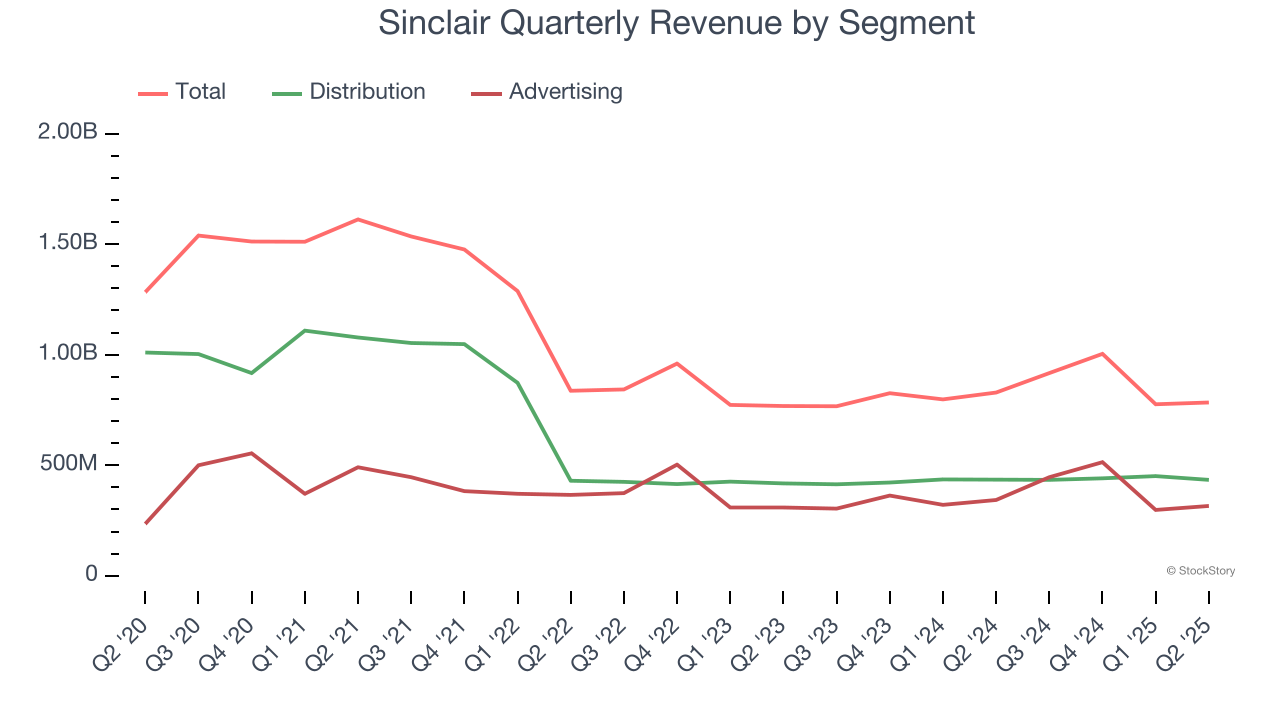
This quarter, Sinclair missed Wall Street’s estimates and reported a rather uninspiring 5.4% year-on-year revenue decline, generating $784 million of revenue. Company management is currently guiding for a 16.7% year-on-year decline in sales next quarter.
Looking further ahead, sell-side analysts expect revenue to decline by 6% over the next 12 months, a deceleration versus the last two years. This projection is underwhelming and suggests its products and services will face some demand challenges.
Software is eating the world and there is virtually no industry left that has been untouched by it. That drives increasing demand for tools helping software developers do their jobs, whether it be monitoring critical cloud infrastructure, integrating audio and video functionality, or ensuring smooth content streaming. Click here to access a free report on our 3 favorite stocks to play this generational megatrend.
Operating Margin
Operating margin is one of the best measures of profitability because it tells us how much money a company takes home after subtracting all core expenses, like marketing and R&D.
Sinclair was profitable over the last five years but held back by its large cost base. Its average operating margin of 3.5% was weak for a business services business.
On the plus side, Sinclair’s operating margin rose by 74.3 percentage points over the last five years.
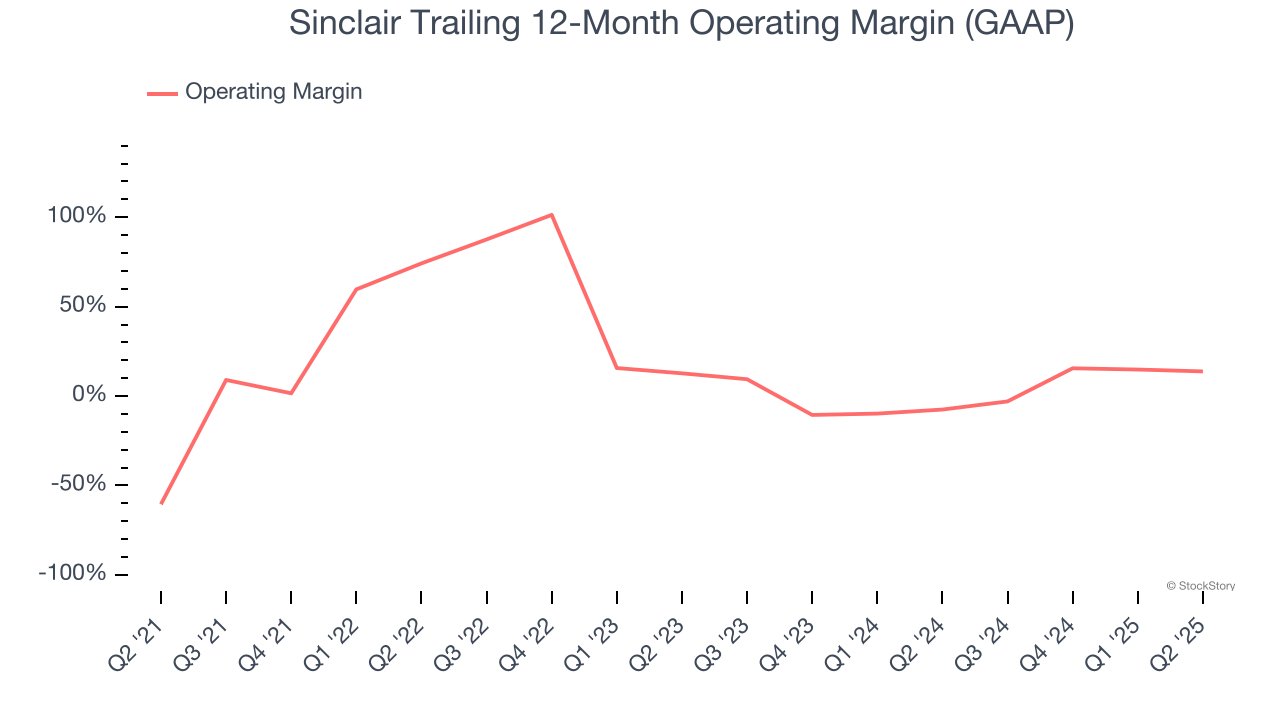
In Q2, Sinclair generated an operating margin profit margin of 2.7%, down 5 percentage points year on year. This contraction shows it was less efficient because its expenses increased relative to its revenue.
Earnings Per Share
Revenue trends explain a company’s historical growth, but the long-term change in earnings per share (EPS) points to the profitability of that growth – for example, a company could inflate its sales through excessive spending on advertising and promotions.
Sadly for Sinclair, its EPS declined by 28% annually over the last five years, more than its revenue. We can see the difference stemmed from higher taxes as the company actually improved its operating margin and repurchased its shares during this time.
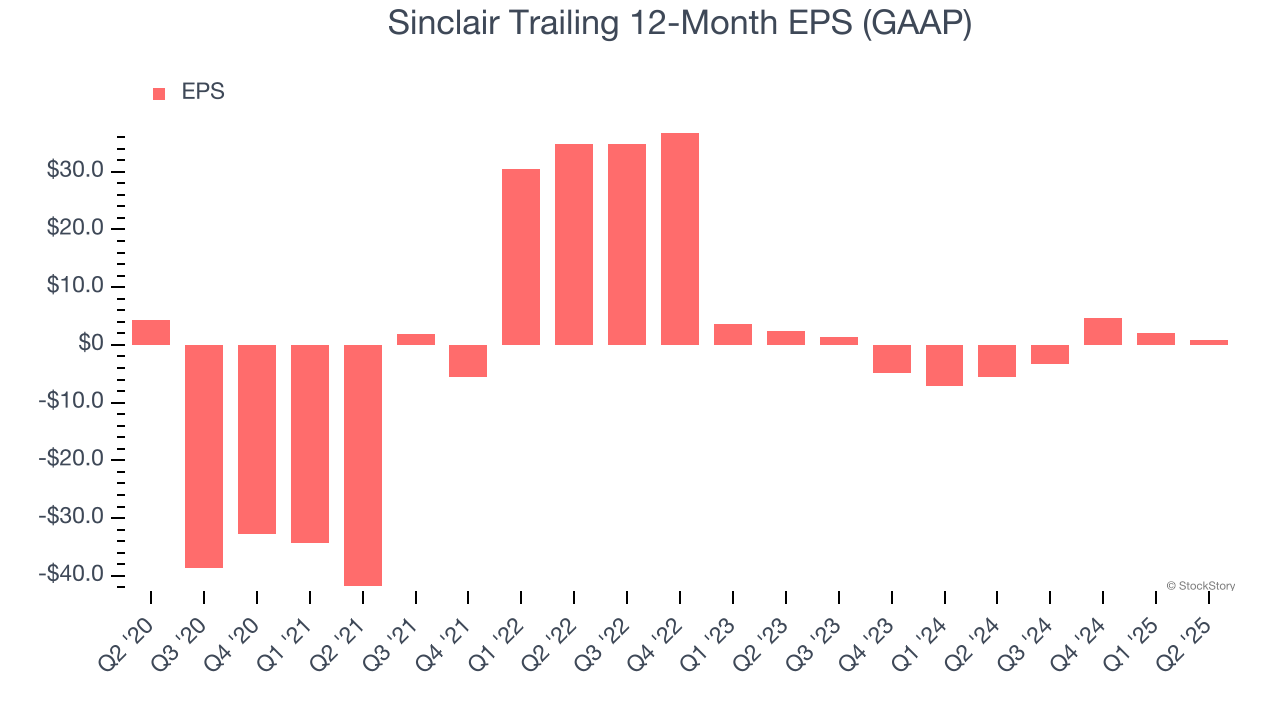
Like with revenue, we analyze EPS over a shorter period to see if we are missing a change in the business.
For Sinclair, its two-year annual EPS declines of 40.8% show it’s continued to underperform. These results were bad no matter how you slice the data.
In Q2, Sinclair reported EPS at negative $0.91, down from $0.27 in the same quarter last year. This print missed analysts’ estimates. Over the next 12 months, Wall Street expects Sinclair to perform poorly. Analysts forecast its full-year EPS of $0.83 will invert to negative negative $1.05.
Key Takeaways from Sinclair’s Q2 Results
We struggled to find many positives in these results as it missed across all key metrics and guided below for next quarter. Overall, this was a weaker print. The stock traded down 6.5% to $13.23 immediately after reporting.
Sinclair may have had a tough quarter, but does that actually create an opportunity to invest right now? When making that decision, it’s important to consider its valuation, business qualities, as well as what has happened in the latest quarter. We cover that in our actionable full research report which you can read here, it’s free.


