Water management company Advanced Drainage Systems (NYSE: WMS) beat Wall Street’s revenue expectations in Q2 CY2025, with sales up 1.8% year on year to $829.9 million. The company expects the full year’s revenue to be around $2.9 billion, close to analysts’ estimates. Its non-GAAP profit of $1.95 per share was 10.9% above analysts’ consensus estimates.
Is now the time to buy Advanced Drainage? Find out by accessing our full research report, it’s free.
Advanced Drainage (WMS) Q2 CY2025 Highlights:
- Revenue: $829.9 million vs analyst estimates of $800.3 million (1.8% year-on-year growth, 3.7% beat)
- Adjusted EPS: $1.95 vs analyst estimates of $1.76 (10.9% beat)
- Adjusted EBITDA: $278.2 million vs analyst estimates of $253.2 million (33.5% margin, 9.9% beat)
- The company reconfirmed its revenue guidance for the full year of $2.9 billion at the midpoint
- EBITDA guidance for the full year is $880 million at the midpoint, in line with analyst expectations
- Operating Margin: 24.8%, down from 27.7% in the same quarter last year
- Free Cash Flow Margin: 26.8%, up from 15.4% in the same quarter last year
- Market Capitalization: $8.84 billion
Scott Barbour, President and Chief Executive Officer of ADS commented, "We delivered strong results in the fiscal first quarter, with Adjusted EBITDA margin of 33.5%. Wet weather in May and June continued to delay project installations, and elevated interest rates remain a headwind. However, the ADS and Infiltrator teams executed well and remain focused on driving profitable growth and operational performance in a challenging macroeconomic environment."
Company Overview
Originally started as a farm water drainage company, Advanced Drainage Systems (NYSE: WMS) provides clean water management solutions to communities across America.
Revenue Growth
A company’s long-term sales performance can indicate its overall quality. Any business can have short-term success, but a top-tier one grows for years. Luckily, Advanced Drainage’s sales grew at an impressive 10.5% compounded annual growth rate over the last five years. Its growth beat the average industrials company and shows its offerings resonate with customers.
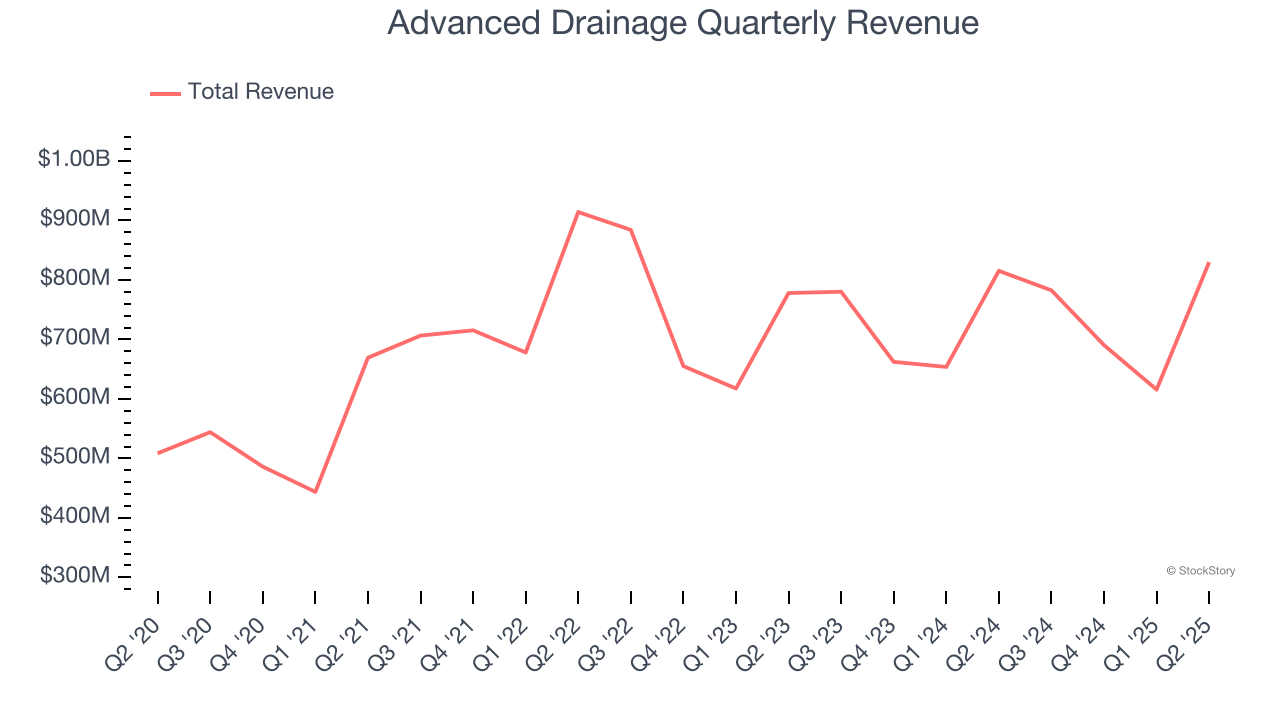
Long-term growth is the most important, but within industrials, a half-decade historical view may miss new industry trends or demand cycles. Advanced Drainage’s recent performance shows its demand has slowed significantly as its revenue was flat over the last two years. 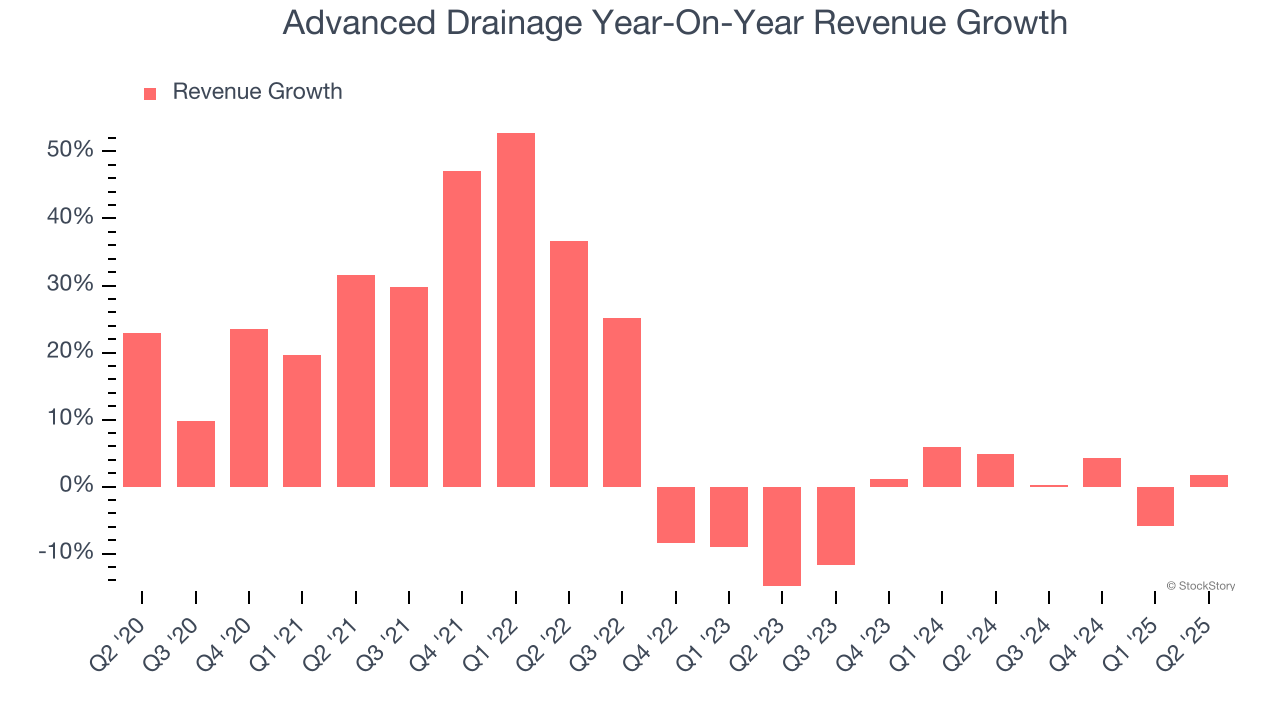
We can dig further into the company’s revenue dynamics by analyzing its most important segments, Pipe
and Infiltrators, which are 54.1% and 21.5% of revenue. Over the last two years, Advanced Drainage’s Pipe
revenue (thermoplastic corrugated pipes) averaged 4.3% year-on-year declines. On the other hand, its Infiltrators revenue (wastewater treatment systems) averaged 15.7% growth. 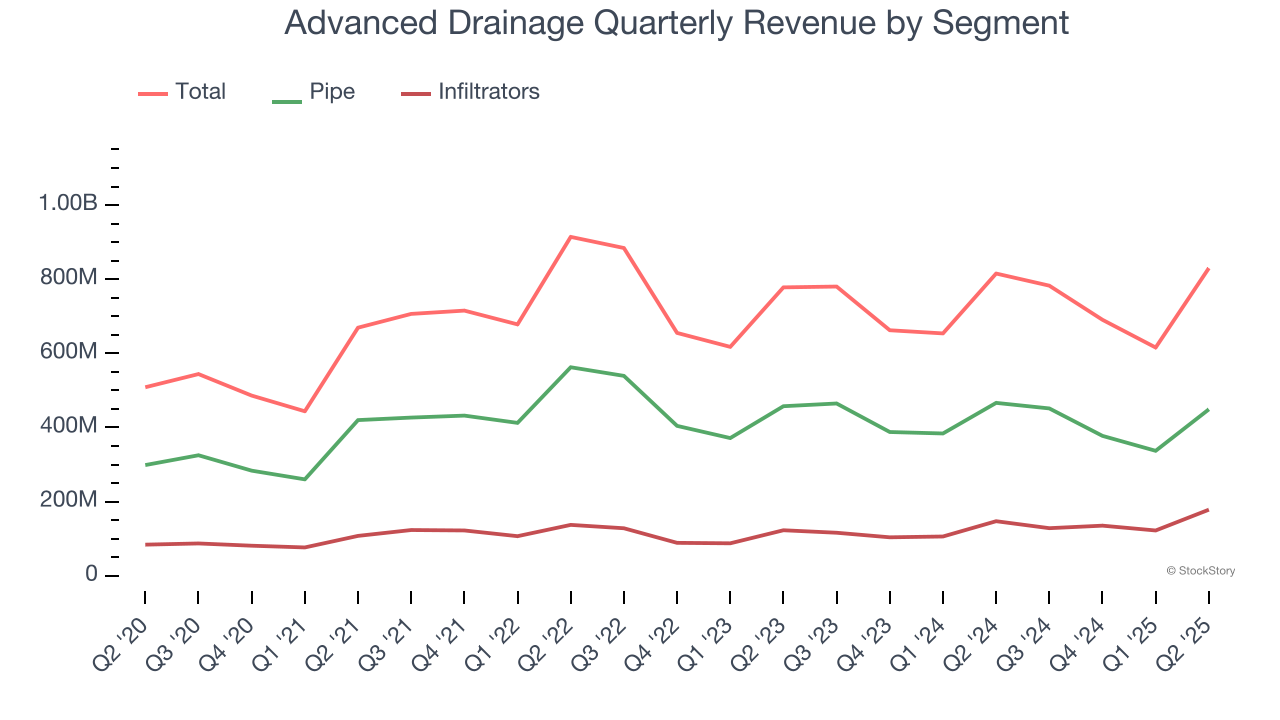
This quarter, Advanced Drainage reported modest year-on-year revenue growth of 1.8% but beat Wall Street’s estimates by 3.7%.
Looking ahead, sell-side analysts expect revenue to grow 2.7% over the next 12 months. While this projection suggests its newer products and services will catalyze better top-line performance, it is still below the sector average.
Unless you’ve been living under a rock, it should be obvious by now that generative AI is going to have a huge impact on how large corporations do business. While Nvidia and AMD are trading close to all-time highs, we prefer a lesser-known (but still profitable) stock benefiting from the rise of AI. Click here to access our free report one of our favorites growth stories.
Operating Margin
Advanced Drainage has been a well-oiled machine over the last five years. It demonstrated elite profitability for an industrials business, boasting an average operating margin of 21.3%. This result isn’t surprising as its high gross margin gives it a favorable starting point.
Looking at the trend in its profitability, Advanced Drainage’s operating margin rose by 5.6 percentage points over the last five years, as its sales growth gave it immense operating leverage.
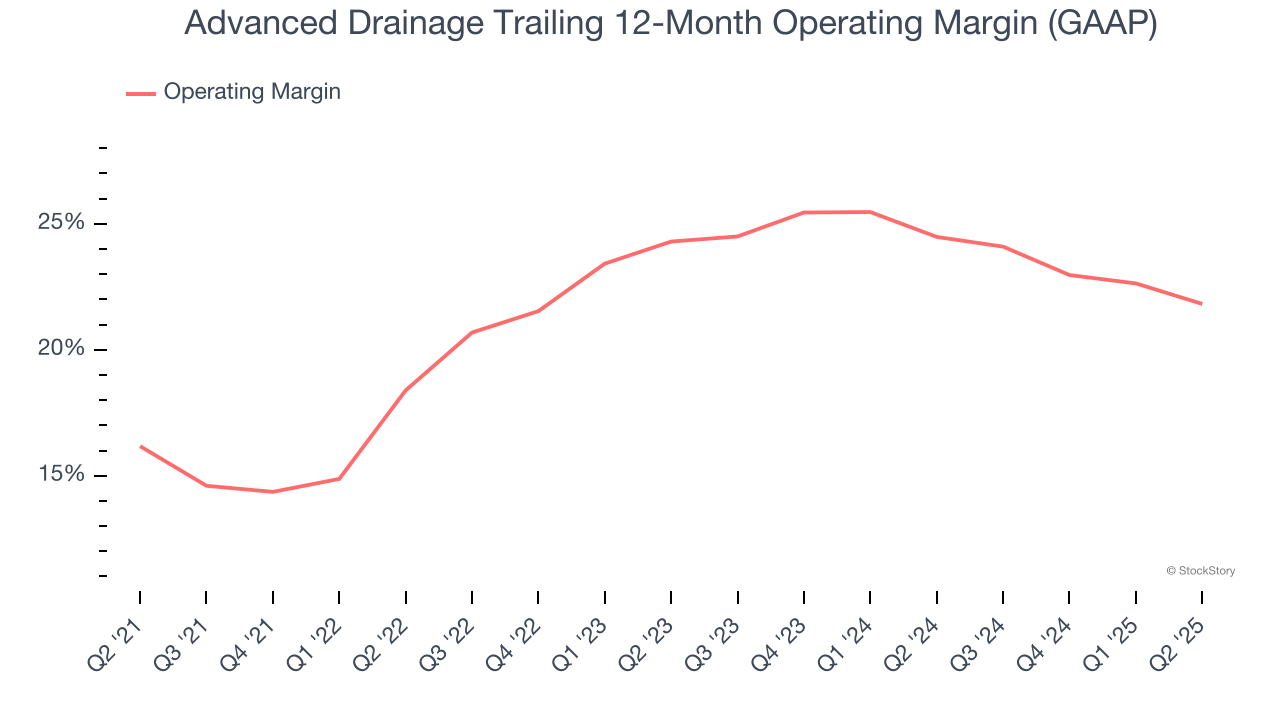
This quarter, Advanced Drainage generated an operating margin profit margin of 24.8%, down 3 percentage points year on year. Since Advanced Drainage’s operating margin decreased more than its gross margin, we can assume it was less efficient because expenses such as marketing, R&D, and administrative overhead increased.
Earnings Per Share
Revenue trends explain a company’s historical growth, but the long-term change in earnings per share (EPS) points to the profitability of that growth – for example, a company could inflate its sales through excessive spending on advertising and promotions.
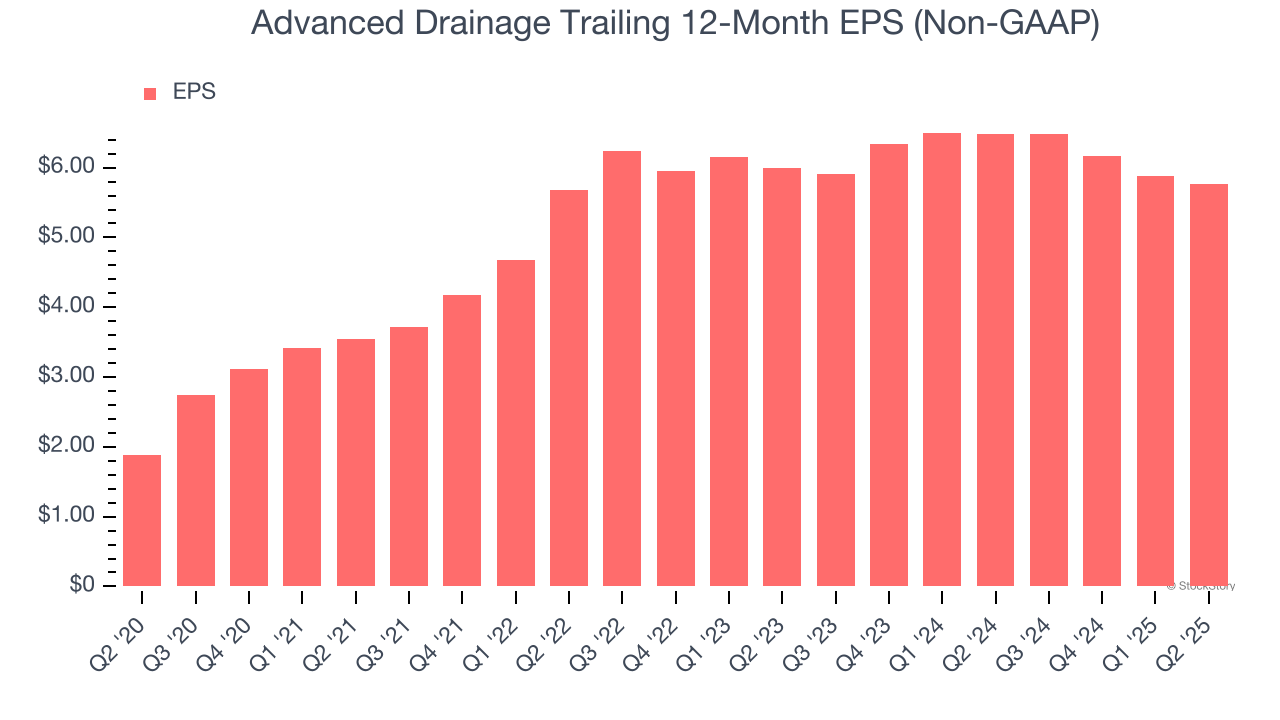
Advanced Drainage’s EPS grew at an astounding 25.1% compounded annual growth rate over the last five years, higher than its 10.5% annualized revenue growth. This tells us the company became more profitable on a per-share basis as it expanded.
We can take a deeper look into Advanced Drainage’s earnings quality to better understand the drivers of its performance. As we mentioned earlier, Advanced Drainage’s operating margin declined this quarter but expanded by 5.6 percentage points over the last five years. This was the most relevant factor (aside from the revenue impact) behind its higher earnings; interest expenses and taxes can also affect EPS but don’t tell us as much about a company’s fundamentals.
Like with revenue, we analyze EPS over a shorter period to see if we are missing a change in the business.
For Advanced Drainage, its two-year annual EPS declines of 1.9% mark a reversal from its (seemingly) healthy five-year trend. We hope Advanced Drainage can return to earnings growth in the future.
In Q2, Advanced Drainage reported adjusted EPS at $1.95, down from $2.06 in the same quarter last year. Despite falling year on year, this print easily cleared analysts’ estimates. Over the next 12 months, Wall Street expects Advanced Drainage’s full-year EPS of $5.77 to stay about the same.
Key Takeaways from Advanced Drainage’s Q2 Results
We were impressed by how significantly Advanced Drainage blew past analysts’ EBITDA expectations this quarter. We were also excited its revenue outperformed Wall Street’s estimates by a wide margin. Overall, we think this was still a solid quarter with some key areas of upside. The stock traded up 16.6% to $132.64 immediately after reporting.
Advanced Drainage had an encouraging quarter, but one earnings result doesn’t necessarily make the stock a buy. Let’s see if this is a good investment. When making that decision, it’s important to consider its valuation, business qualities, as well as what has happened in the latest quarter. We cover that in our actionable full research report which you can read here, it’s free.