
Pet products provider Bark (NYSE: BARK) announced better-than-expected revenue in Q2 CY2025, but sales fell by 11.5% year on year to $102.9 million. On the other hand, next quarter’s revenue guidance of $103.5 million was less impressive, coming in 8.1% below analysts’ estimates. Its non-GAAP loss of $0.02 per share was in line with analysts’ consensus estimates.
Is now the time to buy Bark? Find out by accessing our full research report, it’s free.
Bark (BARK) Q2 CY2025 Highlights:
- Revenue: $102.9 million vs analyst estimates of $100.1 million (11.5% year-on-year decline, 2.8% beat)
- Adjusted EPS: -$0.02 vs analyst estimates of -$0.02 (in line)
- Adjusted EBITDA: $88,000 vs analyst estimates of -$470,330 (0.1% margin, relatively in line)
- Revenue Guidance for Q3 CY2025 is $103.5 million at the midpoint, below analyst estimates of $112.6 million
- EBITDA guidance for Q3 CY2025 is $0 at the midpoint, below analyst estimates of $823,000
- Operating Margin: -8.1%, in line with the same quarter last year
- Free Cash Flow was -$6.15 million compared to -$251,000 in the same quarter last year
- Market Capitalization: $144.7 million
“We entered fiscal 2026 with two clear priorities: maintain positive adjusted EBITDA and accelerate diversification beyond subscription boxes,” said Matt Meeker, Co-Founder and Chief Executive Officer of BARK.
Company Overview
Making a name for itself with the BarkBox, Bark (NYSE: BARK) specializes in subscription-based, personalized pet products.
Revenue Growth
Examining a company’s long-term performance can provide clues about its quality. Any business can put up a good quarter or two, but the best consistently grow over the long haul. Over the last five years, Bark grew its sales at a 13.6% compounded annual growth rate. Although this growth is acceptable on an absolute basis, it fell short of our standards for the consumer discretionary sector, which enjoys a number of secular tailwinds.
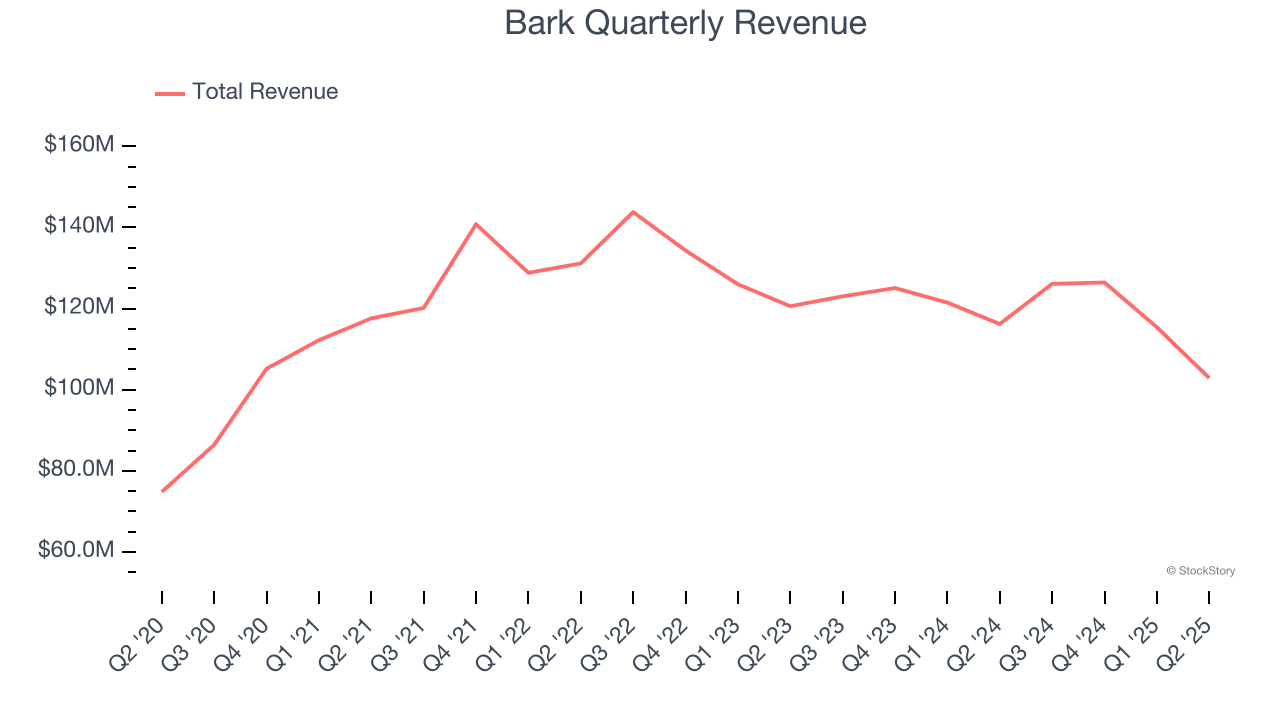
We at StockStory place the most emphasis on long-term growth, but within consumer discretionary, a stretched historical view may miss a company riding a successful new product or trend. Bark’s performance shows it grew in the past but relinquished its gains over the last two years, as its revenue fell by 5.3% annually. 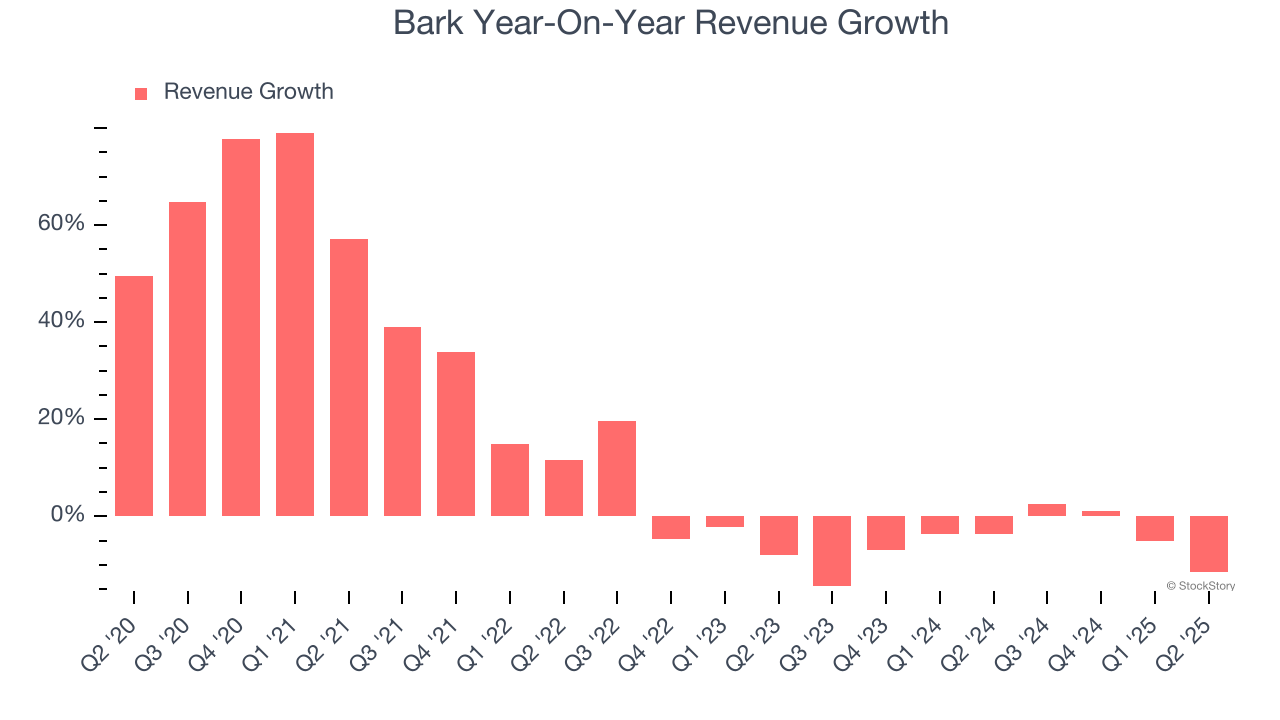
This quarter, Bark’s revenue fell by 11.5% year on year to $102.9 million but beat Wall Street’s estimates by 2.8%. Company management is currently guiding for a 17.9% year-on-year decline in sales next quarter.
Looking further ahead, sell-side analysts expect revenue to decline by 7.2% over the next 12 months, a slight deceleration versus the last two years. This projection is underwhelming and suggests its products and services will face some demand challenges.
Here at StockStory, we certainly understand the potential of thematic investing. Diverse winners from Microsoft (MSFT) to Alphabet (GOOG), Coca-Cola (KO) to Monster Beverage (MNST) could all have been identified as promising growth stories with a megatrend driving the growth. So, in that spirit, we’ve identified a relatively under-the-radar profitable growth stock benefiting from the rise of AI, available to you FREE via this link.
Operating Margin
Operating margin is an important measure of profitability as it shows the portion of revenue left after accounting for all core expenses – everything from the cost of goods sold to advertising and wages. It’s also useful for comparing profitability across companies with different levels of debt and tax rates because it excludes interest and taxes.
Bark’s operating margin has risen over the last 12 months, but it still averaged negative 7.8% over the last two years. This is due to its large expense base and inefficient cost structure.
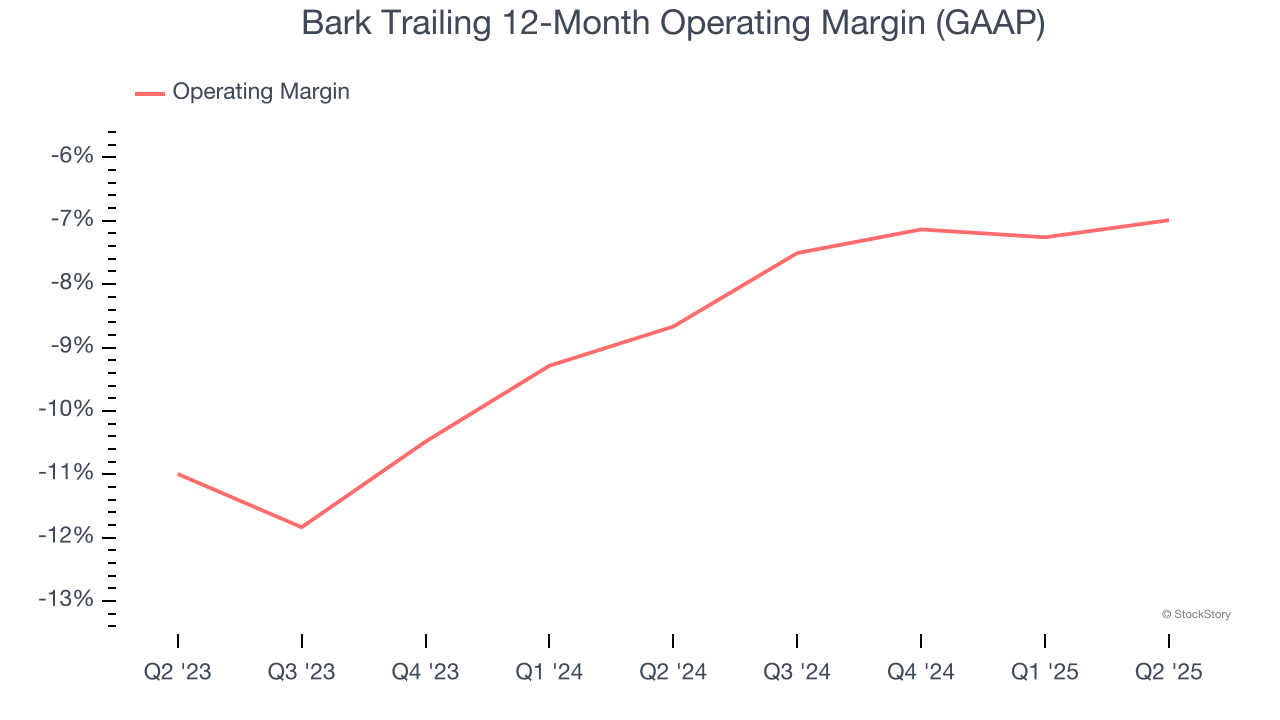
Bark’s operating margin was negative 8.1% this quarter. The company's consistent lack of profits raise a flag.
Earnings Per Share
Revenue trends explain a company’s historical growth, but the change in earnings per share (EPS) points to the profitability of that growth – for example, a company could inflate its sales through excessive spending on advertising and promotions.
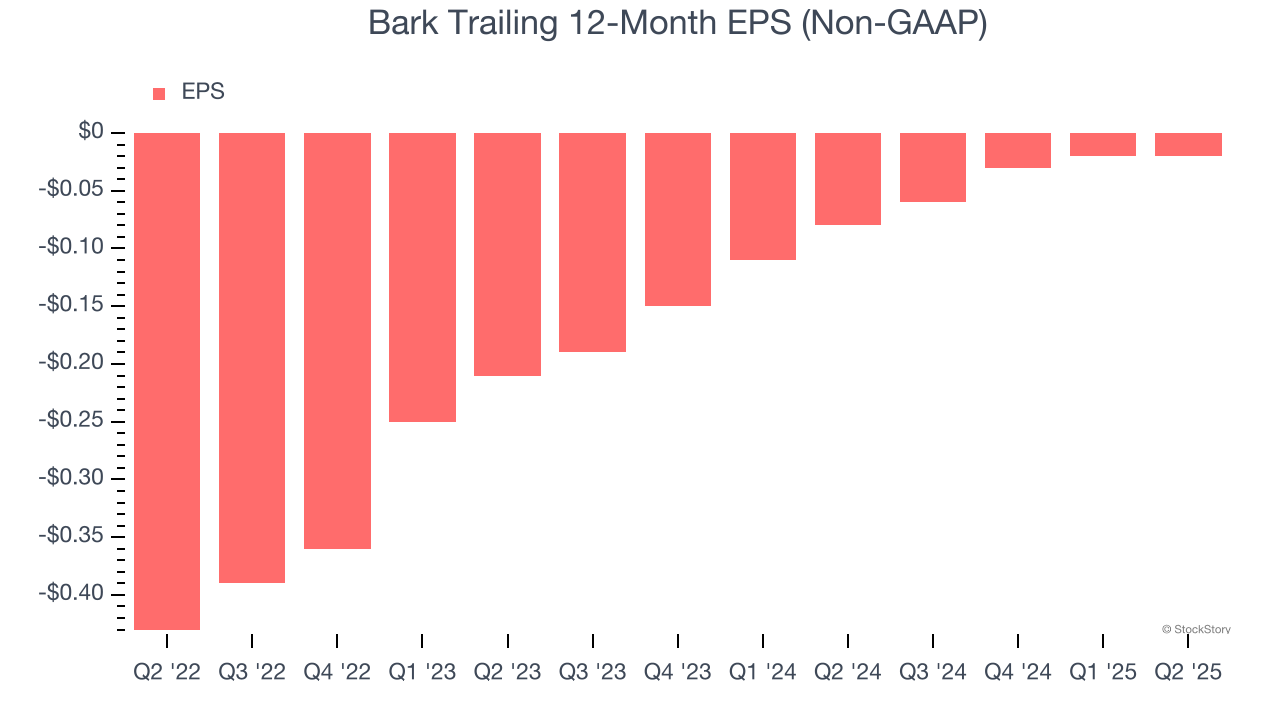
In Q2, Bark reported adjusted EPS at negative $0.02, in line with the same quarter last year. This print missed analysts’ estimates. We also like to analyze expected EPS growth based on Wall Street analysts’ consensus projections, but there is insufficient data.
Key Takeaways from Bark’s Q2 Results
We were impressed by how Bark beat analysts’ revenue expectations this quarter. On the other hand, its adjusted operating income missed, its EPS fell short, and it guided below. Overall, this was a weaker quarter. The stock traded down 3.3% to $0.83 immediately after reporting.
Bark’s latest earnings report disappointed. One quarter doesn’t define a company’s quality, so let’s explore whether the stock is a buy at the current price. The latest quarter does matter, but not nearly as much as longer-term fundamentals and valuation, when deciding if the stock is a buy. We cover that in our actionable full research report which you can read here, it’s free.