
Pharmaceutical company Collegium Pharmaceutical (NASDAQ: COLL) reported Q2 CY2025 results beating Wall Street’s revenue expectations, with sales up 29.4% year on year to $188 million. The company’s full-year revenue guidance of $752.5 million at the midpoint came in 0.9% above analysts’ estimates. Its non-GAAP profit of $1.68 per share was 9.2% below analysts’ consensus estimates.
Is now the time to buy Collegium Pharmaceutical? Find out by accessing our full research report, it’s free.
Collegium Pharmaceutical (COLL) Q2 CY2025 Highlights:
- Revenue: $188 million vs analyst estimates of $180.4 million (29.4% year-on-year growth, 4.2% beat)
- Adjusted EPS: $1.68 vs analyst expectations of $1.85 (9.2% miss)
- Adjusted EBITDA: $105.1 million vs analyst estimates of $103.7 million (55.9% margin, 1.4% beat)
- The company lifted its revenue guidance for the full year to $752.5 million at the midpoint from $742.5 million, a 1.3% increase
- EBITDA guidance for the full year is $447.5 million at the midpoint, above analyst estimates of $437.6 million
- Operating Margin: 18.7%, down from 32.7% in the same quarter last year
- Market Capitalization: $956.2 million
“We continued to generate strong momentum in the second quarter, driven by sustained execution across our three strategic priorities, including record revenue from Jornay PM, maximizing our pain portfolio, and strategically deploying capital to enhance shareholder value,” said Vikram Karnani, President and Chief Executive Officer.
Company Overview
Pioneering abuse-deterrent technology in a field plagued by addiction concerns, Collegium Pharmaceutical (NASDAQ: COLL) develops and markets specialty medications for treating moderate to severe pain, including abuse-deterrent opioid formulations.
Revenue Growth
A company’s long-term performance is an indicator of its overall quality. Even a bad business can shine for one or two quarters, but a top-tier one grows for years. Over the last five years, Collegium Pharmaceutical grew its sales at an impressive 18.6% compounded annual growth rate. Its growth beat the average healthcare company and shows its offerings resonate with customers.
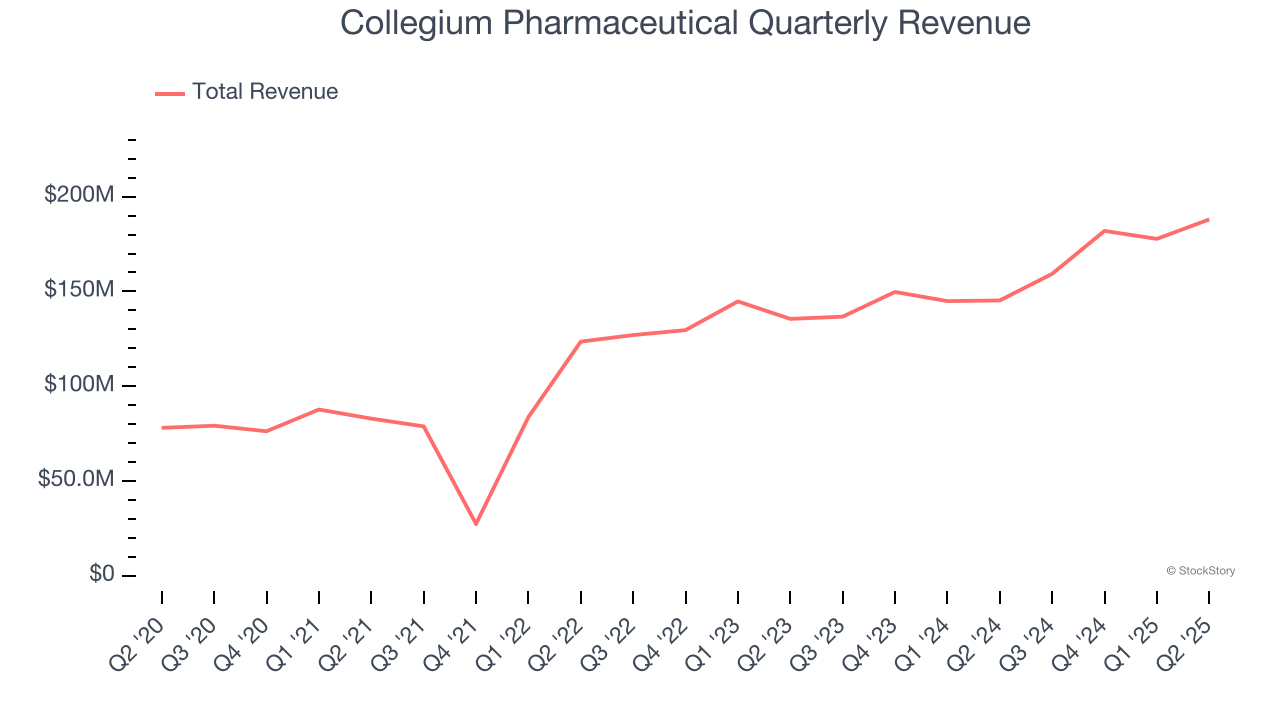
Long-term growth is the most important, but within healthcare, a half-decade historical view may miss new innovations or demand cycles. Collegium Pharmaceutical’s annualized revenue growth of 14.7% over the last two years is below its five-year trend, but we still think the results suggest healthy demand. 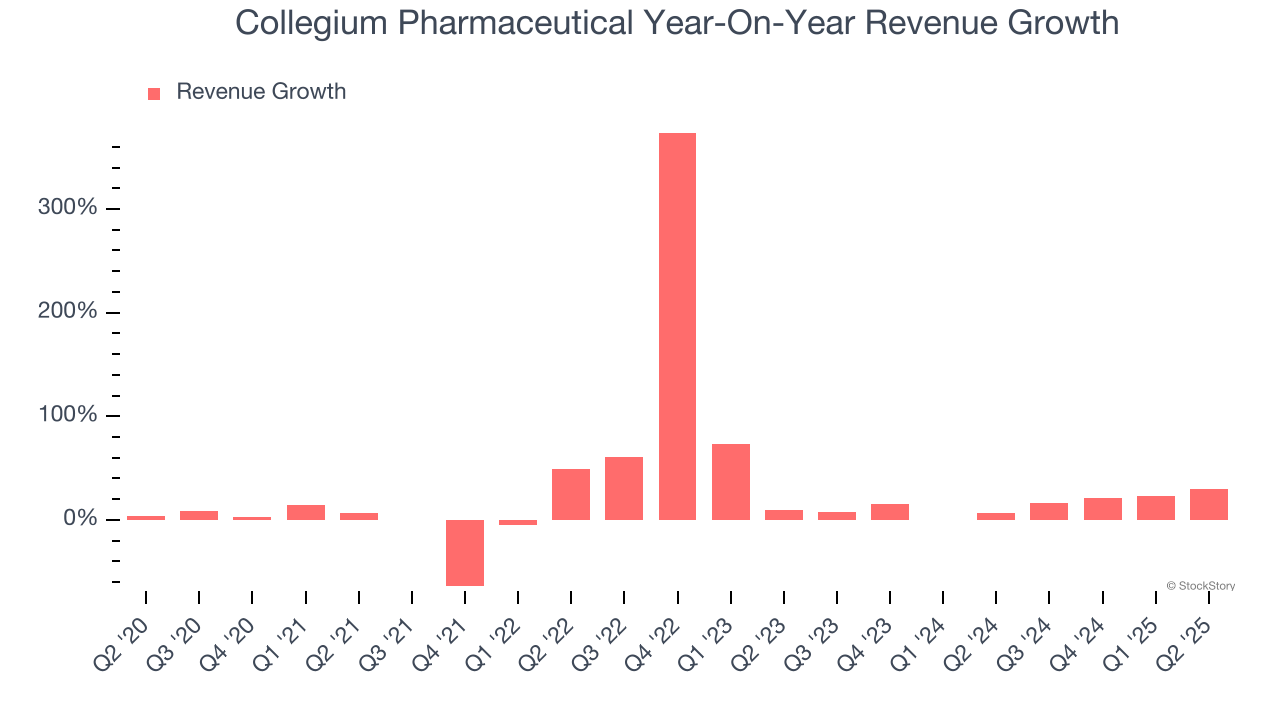
This quarter, Collegium Pharmaceutical reported robust year-on-year revenue growth of 29.4%, and its $188 million of revenue topped Wall Street estimates by 4.2%.
Looking ahead, sell-side analysts expect revenue to grow 7.9% over the next 12 months, a deceleration versus the last two years. Still, this projection is above the sector average and suggests the market is baking in some success for its newer products and services.
Unless you’ve been living under a rock, it should be obvious by now that generative AI is going to have a huge impact on how large corporations do business. While Nvidia and AMD are trading close to all-time highs, we prefer a lesser-known (but still profitable) stock benefiting from the rise of AI. Click here to access our free report one of our favorites growth stories.
Operating Margin
Operating margin is one of the best measures of profitability because it tells us how much money a company takes home after subtracting all core expenses, like marketing and R&D.
Collegium Pharmaceutical has managed its cost base well over the last five years. It demonstrated solid profitability for a healthcare business, producing an average operating margin of 19.5%.
Analyzing the trend in its profitability, Collegium Pharmaceutical’s operating margin decreased by 3.8 percentage points over the last five years, but it rose by 1.1 percentage points on a two-year basis. Still, shareholders will want to see Collegium Pharmaceutical become more profitable in the future.
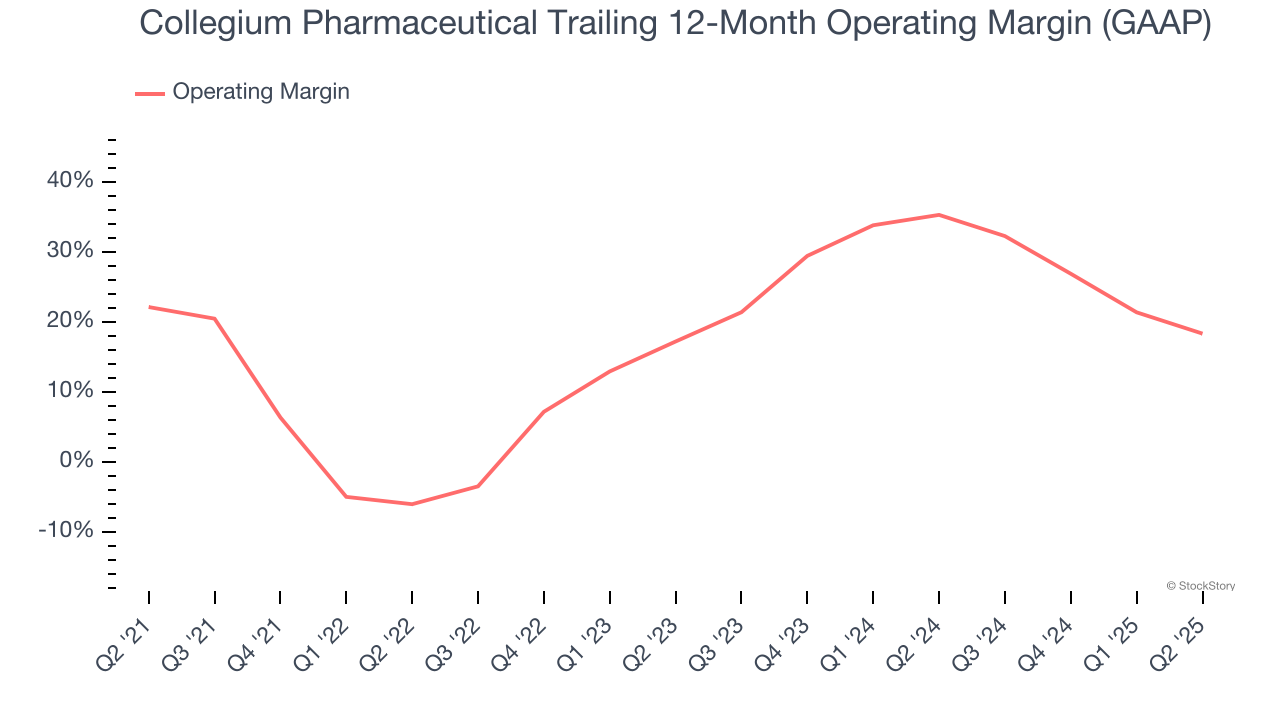
This quarter, Collegium Pharmaceutical generated an operating margin profit margin of 18.7%, down 14 percentage points year on year. This contraction shows it was less efficient because its expenses grew faster than its revenue.
Earnings Per Share
We track the long-term change in earnings per share (EPS) for the same reason as long-term revenue growth. Compared to revenue, however, EPS highlights whether a company’s growth is profitable.
Collegium Pharmaceutical’s EPS grew at an astounding 29.6% compounded annual growth rate over the last five years, higher than its 18.6% annualized revenue growth. However, we take this with a grain of salt because its operating margin didn’t improve and it didn’t repurchase its shares, meaning the delta came from reduced interest expenses or taxes.
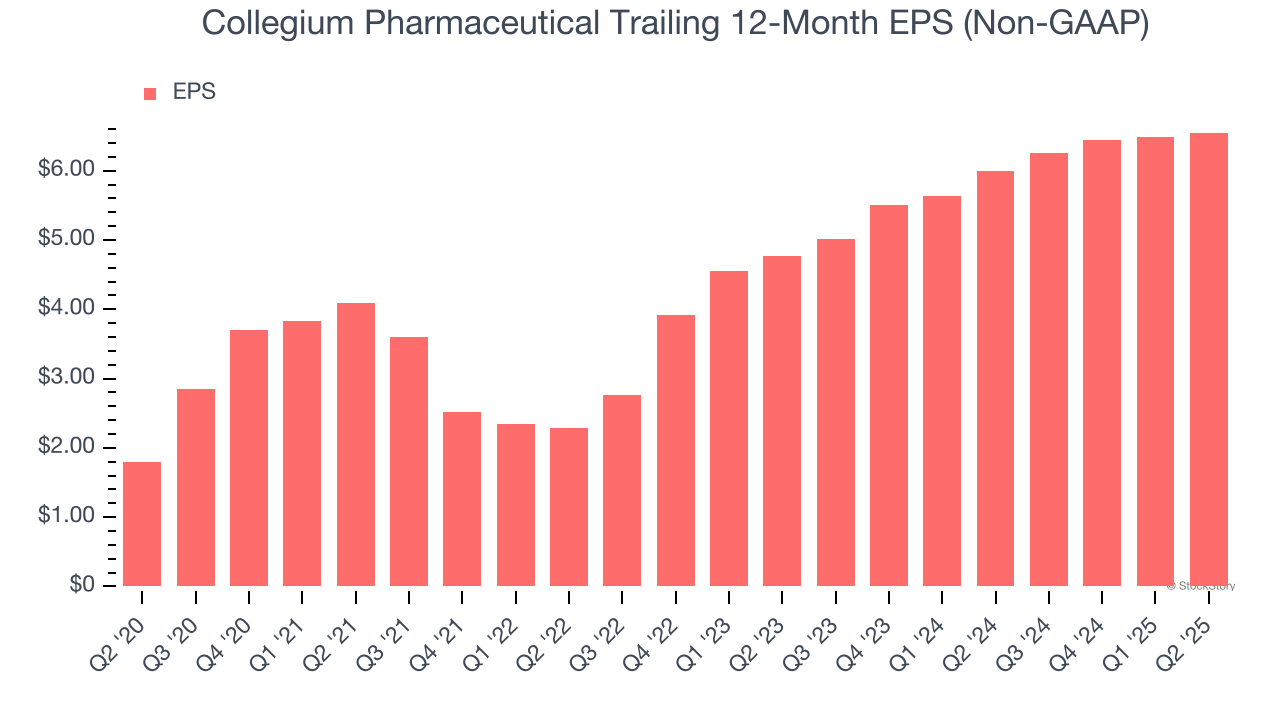
In Q2, Collegium Pharmaceutical reported adjusted EPS at $1.68, up from $1.62 in the same quarter last year. Despite growing year on year, this print missed analysts’ estimates, but we care more about long-term adjusted EPS growth than short-term movements. Over the next 12 months, Wall Street expects Collegium Pharmaceutical’s full-year EPS of $6.55 to grow 14.2%.
Key Takeaways from Collegium Pharmaceutical’s Q2 Results
We enjoyed seeing Collegium Pharmaceutical beat analysts’ revenue expectations this quarter. We were also glad its full-year revenue guidance slightly exceeded Wall Street’s estimates. On the other hand, its EPS missed. Overall, this print had some key positives. The stock traded up 10.2% to $32.75 immediately after reporting.
So do we think Collegium Pharmaceutical is an attractive buy at the current price? We think that the latest quarter is only one piece of the longer-term business quality puzzle. Quality, when combined with valuation, can help determine if the stock is a buy. We cover that in our actionable full research report which you can read here, it’s free.


