Casino, tavern, and slot machine operator Golden Entertainment (NASDAQ: GDEN) fell short of the market’s revenue expectations in Q2 CY2025, with sales falling 2.2% year on year to $163.6 million. Its GAAP profit of $0.17 per share was in line with analysts’ consensus estimates.
Is now the time to buy Golden Entertainment? Find out by accessing our full research report, it’s free.
Golden Entertainment (GDEN) Q2 CY2025 Highlights:
- Revenue: $163.6 million vs analyst estimates of $167.6 million (2.2% year-on-year decline, 2.4% miss)
- EPS (GAAP): $0.17 vs analyst estimates of $0.16 (in line)
- Adjusted EBITDA: $38.44 million vs analyst estimates of $38.7 million (23.5% margin, 0.7% miss)
- Operating Margin: 7.3%, in line with the same quarter last year
- Market Capitalization: $711.1 million
Company Overview
Founded in 2001, Golden Entertainment (NASDAQ: GDEN) is a gaming company operating casinos, taverns, and distributed gaming platforms.
Revenue Growth
Examining a company’s long-term performance can provide clues about its quality. Any business can have short-term success, but a top-tier one grows for years. Golden Entertainment struggled to consistently generate demand over the last five years as its sales dropped at a 3.3% annual rate. This wasn’t a great result, but there are still things to like about Golden Entertainment.
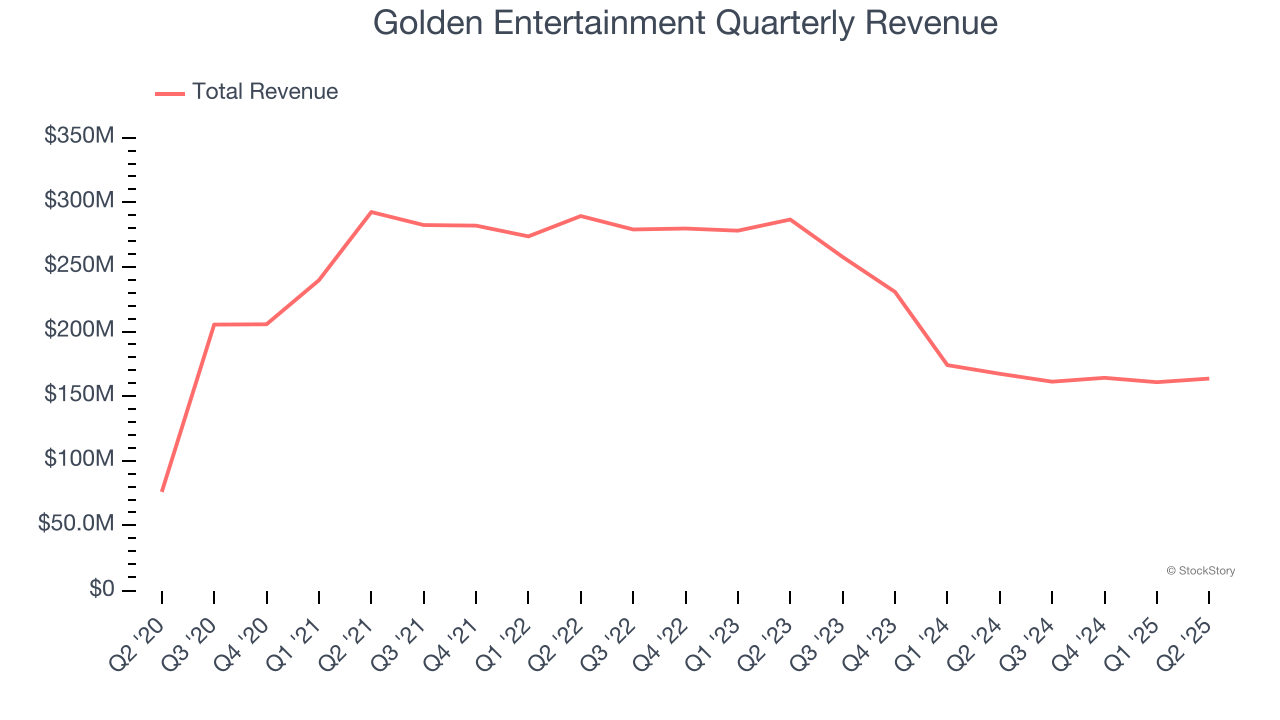
Long-term growth is the most important, but within consumer discretionary, product cycles are short and revenue can be hit-driven due to rapidly changing trends and consumer preferences. Golden Entertainment’s recent performance shows its demand remained suppressed as its revenue has declined by 23.9% annually over the last two years. Note that COVID hurt Golden Entertainment’s business in 2020 and part of 2021, and it bounced back in a big way thereafter. 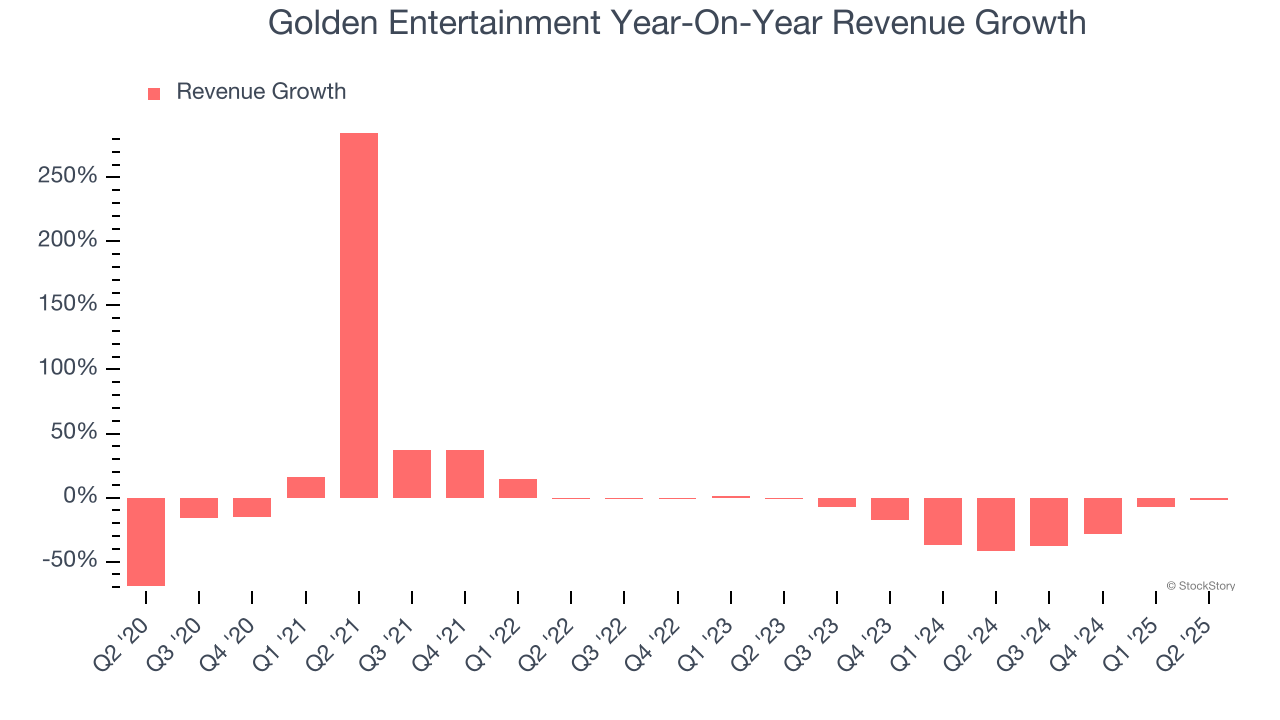
This quarter, Golden Entertainment missed Wall Street’s estimates and reported a rather uninspiring 2.2% year-on-year revenue decline, generating $163.6 million of revenue.
Looking ahead, sell-side analysts expect revenue to grow 2.7% over the next 12 months. Although this projection indicates its newer products and services will catalyze better top-line performance, it is still below average for the sector.
Unless you’ve been living under a rock, it should be obvious by now that generative AI is going to have a huge impact on how large corporations do business. While Nvidia and AMD are trading close to all-time highs, we prefer a lesser-known (but still profitable) stock benefiting from the rise of AI. Click here to access our free report one of our favorites growth stories.
Operating Margin
Operating margin is an important measure of profitability as it shows the portion of revenue left after accounting for all core expenses – everything from the cost of goods sold to advertising and wages. It’s also useful for comparing profitability across companies with different levels of debt and tax rates because it excludes interest and taxes.
Golden Entertainment’s operating margin has shrunk over the last 12 months, but it still averaged 31.5% over the last two years, elite for a consumer discretionary business. This shows it’s an well-run company with an efficient cost structure, and we wouldn’t weigh the short-term trend too heavily.
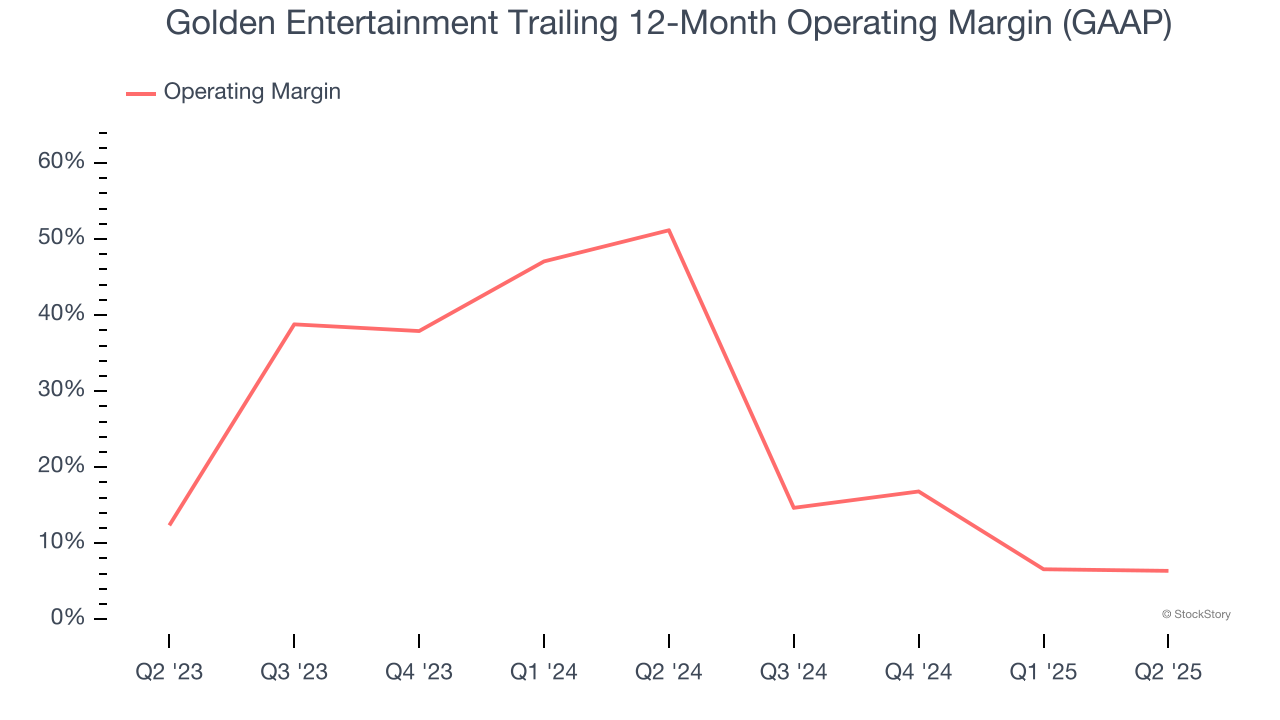
In Q2, Golden Entertainment generated an operating margin profit margin of 7.3%, in line with the same quarter last year. This indicates the company’s overall cost structure has been relatively stable.
Earnings Per Share
We track the long-term change in earnings per share (EPS) for the same reason as long-term revenue growth. Compared to revenue, however, EPS highlights whether a company’s growth is profitable.
Golden Entertainment’s full-year EPS flipped from negative to positive over the last five years. This is a good sign and shows it’s at an inflection point.
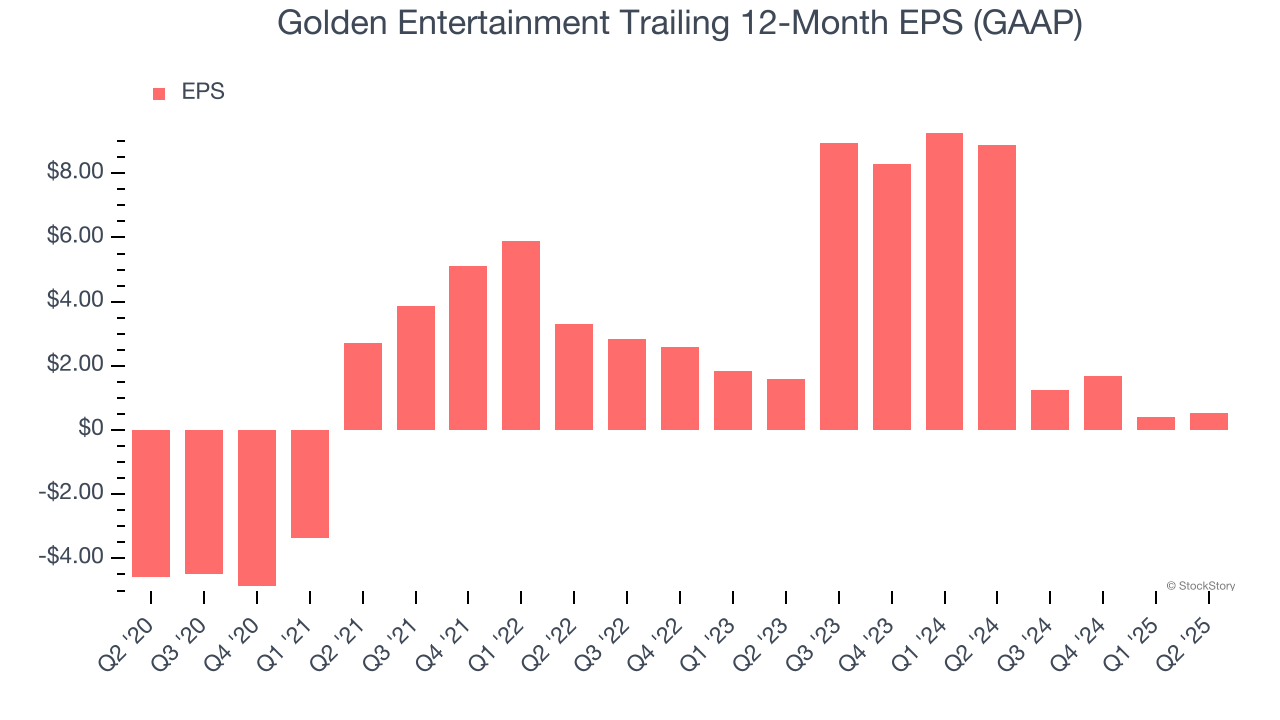
In Q2, Golden Entertainment reported EPS at $0.17, up from $0.02 in the same quarter last year. This print beat analysts’ estimates by 6.1%. Over the next 12 months, Wall Street expects Golden Entertainment’s full-year EPS of $0.54 to grow 35.7%.
Key Takeaways from Golden Entertainment’s Q2 Results
Revenue and EBITDA missed. Overall, this was a weaker quarter. The stock remained flat at $26.76 immediately following the results.
Golden Entertainment underperformed this quarter, but does that create an opportunity to invest right now? When making that decision, it’s important to consider its valuation, business qualities, as well as what has happened in the latest quarter. We cover that in our actionable full research report which you can read here, it’s free.