
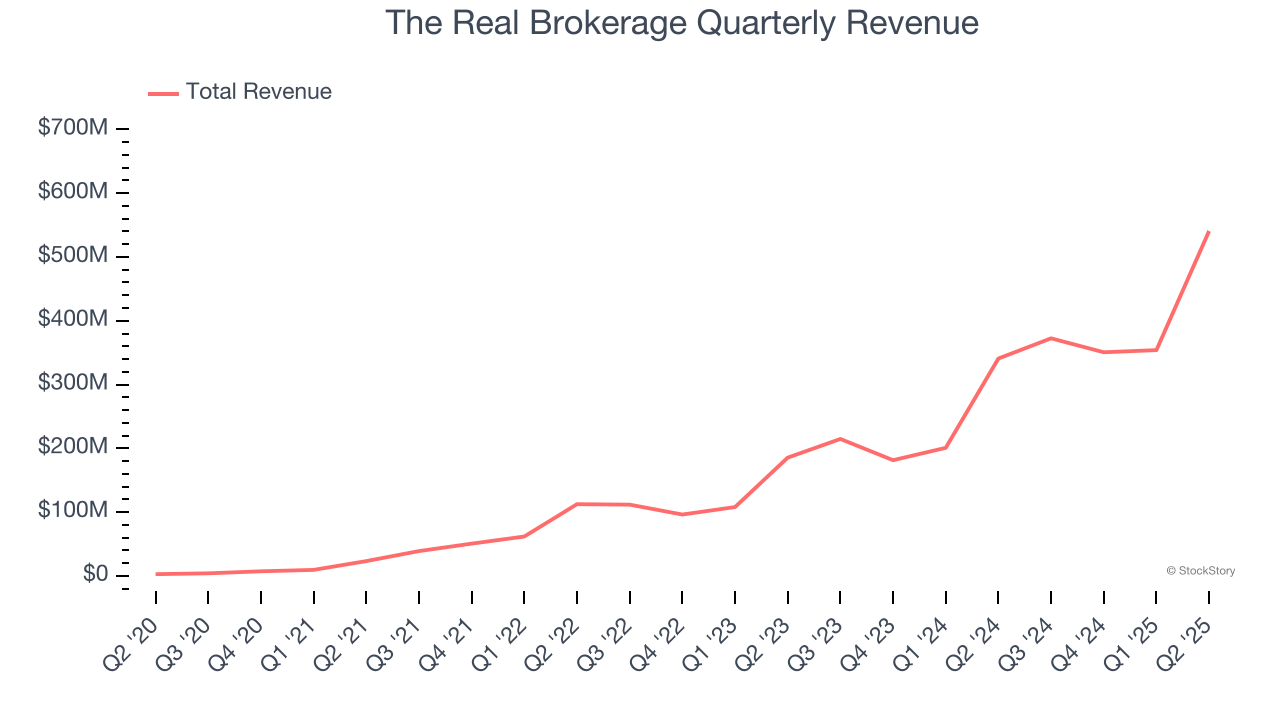
Real estate technology company The Real Brokerage (NASDAQ: REAX) reported Q2 CY2025 results topping the market’s revenue expectations, with sales up 58.7% year on year to $540.7 million. Its GAAP profit of $0.01 per share was in line with analysts’ consensus estimates.
Is now the time to buy The Real Brokerage? Find out by accessing our full research report, it’s free.
The Real Brokerage (REAX) Q2 CY2025 Highlights:
- Revenue: $540.7 million vs analyst estimates of $482.5 million (58.7% year-on-year growth, 12.1% beat)
- EPS (GAAP): $0.01 vs analyst estimates of $0 (in line)
- Adjusted EBITDA: $20.04 million vs analyst estimates of $17.42 million (3.7% margin, 15.1% beat)
- Operating Margin: 0.3%, in line with the same quarter last year
- Free Cash Flow Margin: 7.5%, up from 4.5% in the same quarter last year
- Market Capitalization: $847.5 million
“This quarter marks a pivotal moment for Real, as we proudly announce our first-ever quarter of positive net income,” said Tamir Poleg, Real’s Chairman and Chief Executive Officer.
Company Overview
Founded in Toronto, Canada in 2014, The Real Brokerage (NASDAQ: REAX) is a technology-driven real estate brokerage firm combining a tech-centric model with an agent-centric philosophy.
Revenue Growth
A company’s long-term performance is an indicator of its overall quality. Any business can have short-term success, but a top-tier one grows for years. Over the last five years, The Real Brokerage grew its sales at an incredible 162% compounded annual growth rate. Its growth beat the average consumer discretionary company and shows its offerings resonate with customers.
Long-term growth is the most important, but within consumer discretionary, product cycles are short and revenue can be hit-driven due to rapidly changing trends and consumer preferences. The Real Brokerage’s annualized revenue growth of 79.7% over the last two years is below its five-year trend, but we still think the results suggest healthy demand. 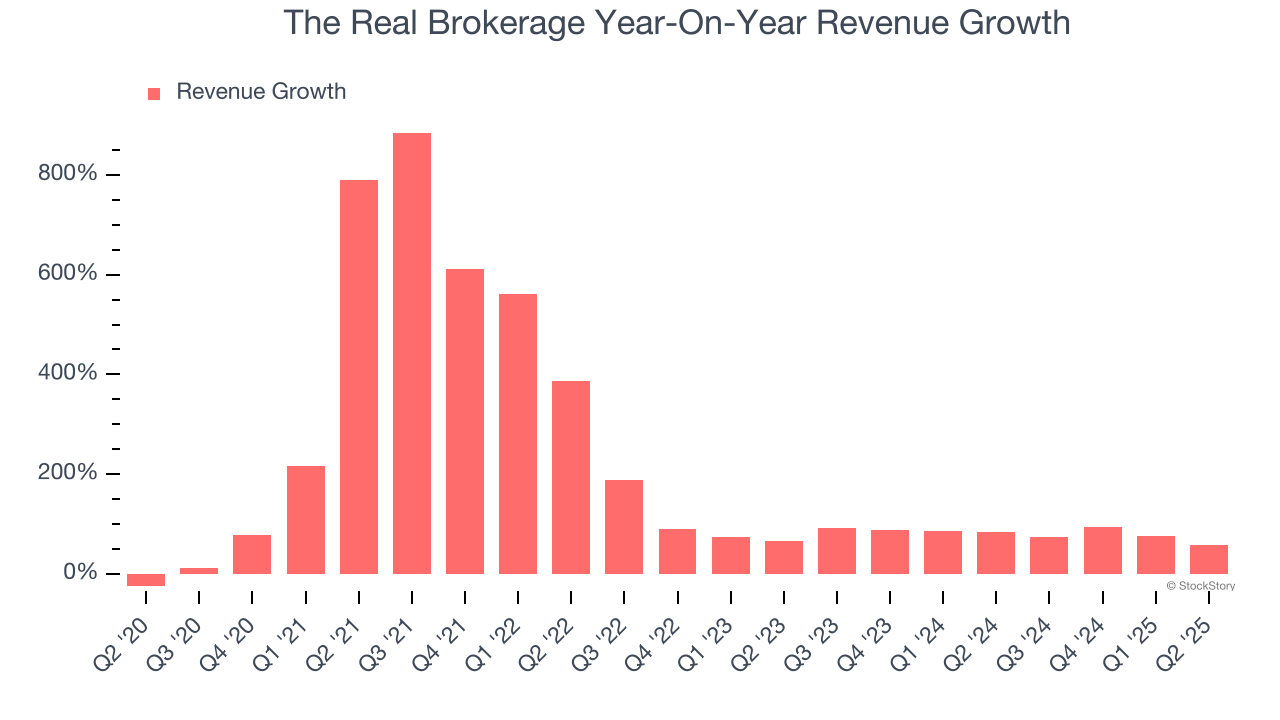
This quarter, The Real Brokerage reported magnificent year-on-year revenue growth of 58.7%, and its $540.7 million of revenue beat Wall Street’s estimates by 12.1%.
Looking ahead, sell-side analysts expect revenue to grow 18% over the next 12 months, a deceleration versus the last two years. Despite the slowdown, this projection is commendable and suggests the market is forecasting success for its products and services.
Here at StockStory, we certainly understand the potential of thematic investing. Diverse winners from Microsoft (MSFT) to Alphabet (GOOG), Coca-Cola (KO) to Monster Beverage (MNST) could all have been identified as promising growth stories with a megatrend driving the growth. So, in that spirit, we’ve identified a relatively under-the-radar profitable growth stock benefiting from the rise of AI, available to you FREE via this link.
Operating Margin
Operating margin is a key measure of profitability. Think of it as net income - the bottom line - excluding the impact of taxes and interest on debt, which are less connected to business fundamentals.
The Real Brokerage’s operating margin has been trending up over the last 12 months, but it still averaged negative 1.4% over the last two years. This is due to its large expense base and inefficient cost structure.
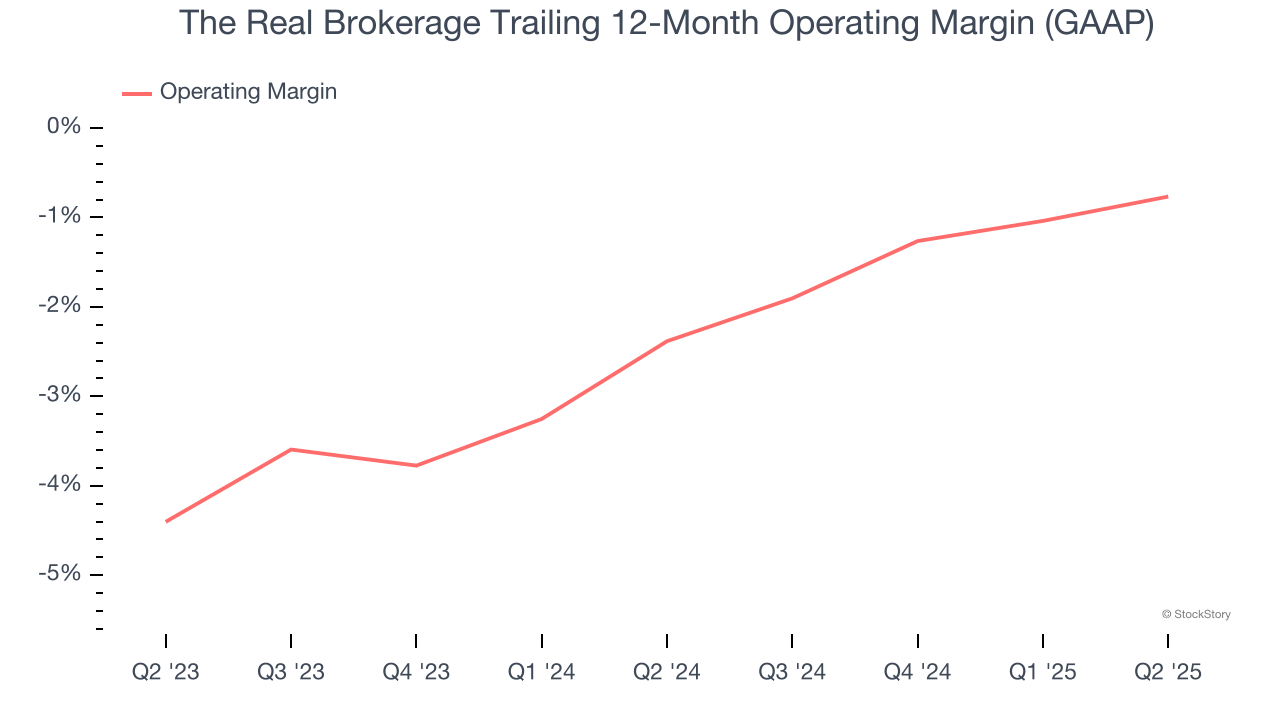
In Q2, The Real Brokerage’s breakeven margin was in line with the same quarter last year. This indicates the company’s overall cost structure has been relatively stable.
Earnings Per Share
Revenue trends explain a company’s historical growth, but the long-term change in earnings per share (EPS) points to the profitability of that growth – for example, a company could inflate its sales through excessive spending on advertising and promotions.
The Real Brokerage’s full-year EPS was flat over the last five years. This performance was underwhelming across the board.
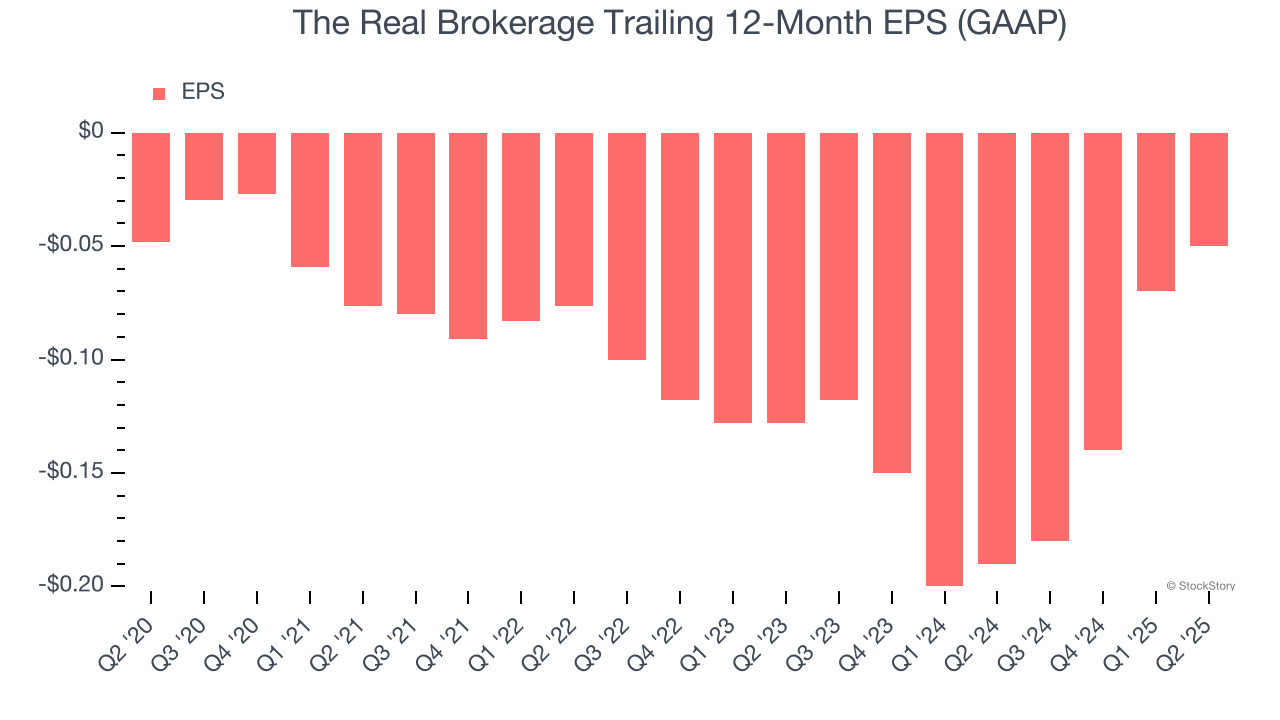
In Q2, The Real Brokerage reported EPS at $0.01, up from negative $0.01 in the same quarter last year. This print easily cleared analysts’ estimates, and shareholders should be content with the results. Over the next 12 months, Wall Street is optimistic. Analysts forecast The Real Brokerage’s full-year EPS of negative $0.05 will reach break even.
Key Takeaways from The Real Brokerage’s Q2 Results
We were impressed by how significantly The Real Brokerage blew past analysts’ EPS expectations this quarter. We were also excited its revenue outperformed Wall Street’s estimates by a wide margin. Zooming out, we think this was a good print with some key areas of upside. The market seemed to be hoping for more, and the stock traded down 1.3% to $4.05 immediately following the results.
Is The Real Brokerage an attractive investment opportunity right now? The latest quarter does matter, but not nearly as much as longer-term fundamentals and valuation, when deciding if the stock is a buy. We cover that in our actionable full research report which you can read here, it’s free.