
Commercial real estate finance company Walker & Dunlop (NYSE: WD) reported revenue ahead of Wall Street’s expectations in Q2 CY2025, with sales up 17.9% year on year to $319.2 million. Its non-GAAP loss of $1.08 per share was significantly below analysts’ consensus estimates.
Is now the time to buy Walker & Dunlop? Find out by accessing our full research report, it’s free.
Walker & Dunlop (WD) Q2 CY2025 Highlights:
- Revenue: $319.2 million vs analyst estimates of $272.7 million (17.9% year-on-year growth, 17.1% beat)
- Efficiency Ratio: 26%
- Adjusted EPS: -$1.08 vs analyst estimates of $0.97 (significant miss)
- Market Capitalization: $2.56 billion
“Walker & Dunlop’s second quarter results demonstrate terrific performance by our team in what appears to be the advent of the next commercial real estate investment cycle,” commented Walker & Dunlop Chairman and CEO, Willy Walker.
Company Overview
Originating as a small mortgage banking firm during the Great Depression in 1937, Walker & Dunlop (NYSE: WD) provides commercial real estate financing, property sales, appraisal, and investment management services with a focus on multifamily properties.
Sales Growth
From lending activities to service fees, most banks build their revenue model around two income sources. Interest rate spreads between loans and deposits create the first stream, with the second coming from charges on everything from basic bank accounts to complex investment banking transactions.
Thankfully, Walker & Dunlop’s 5.4% annualized revenue growth over the last five years was decent. Its growth was slightly above the average bank company and shows its offerings resonate with customers.
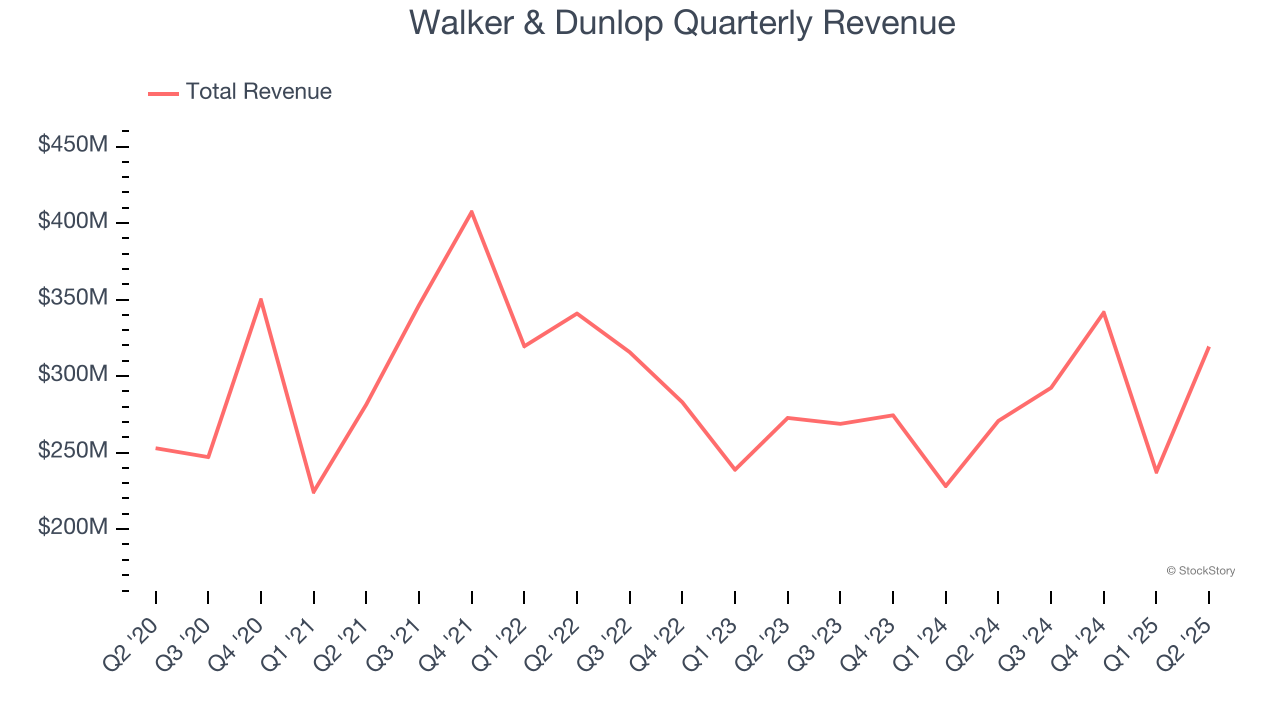
Long-term growth is the most important, but within financials, a half-decade historical view may miss recent interest rate changes and market returns. Walker & Dunlop’s recent performance shows its demand has slowed as its annualized revenue growth of 3.6% over the last two years was below its five-year trend. 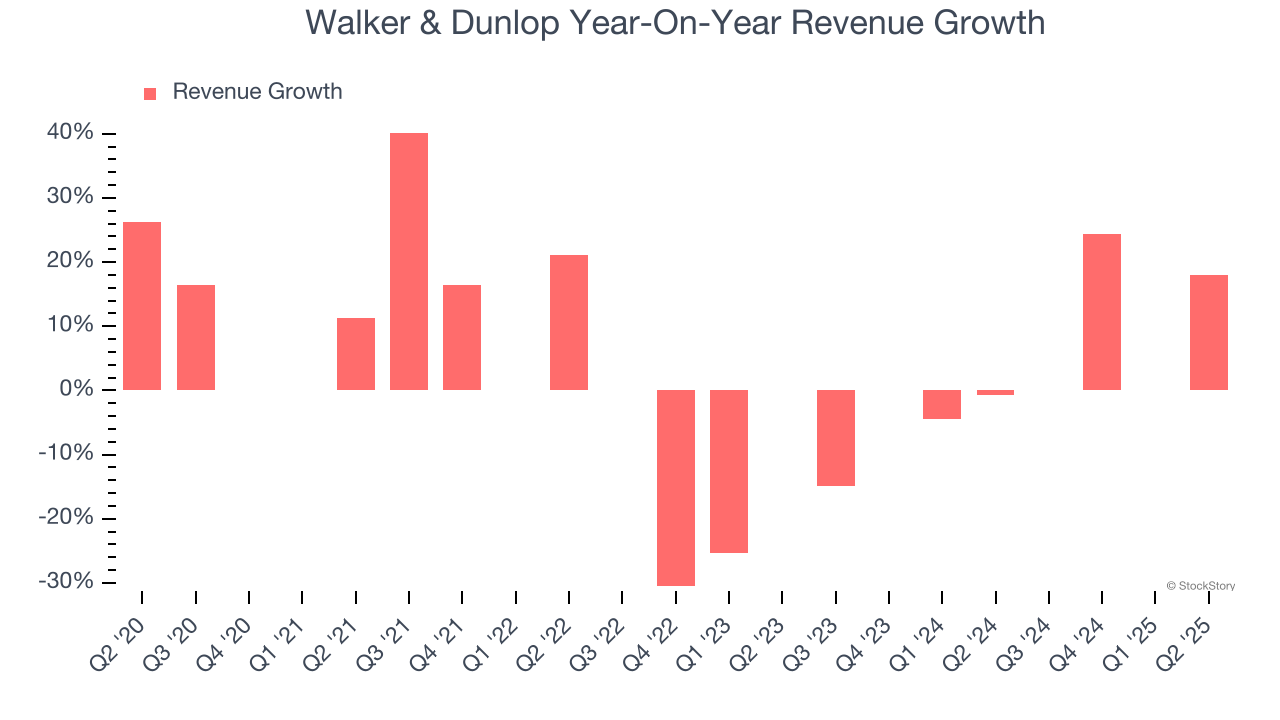 Note: Quarters not shown were determined to be outliers, impacted by outsized investment gains/losses that are not indicative of the recurring fundamentals of the business.
This quarter, Walker & Dunlop reported year-on-year revenue growth of 17.9%, and its $319.2 million of revenue exceeded Wall Street’s estimates by 17.1%.
Net interest income made up 0% of the company’s total revenue during the last five years, meaning Walker & Dunlop is well diversified and has a variety of income streams driving its overall growth. Nevertheless, net interest income is critical to analyze for banks because they’re considered a higher-quality, more recurring revenue source by investors.
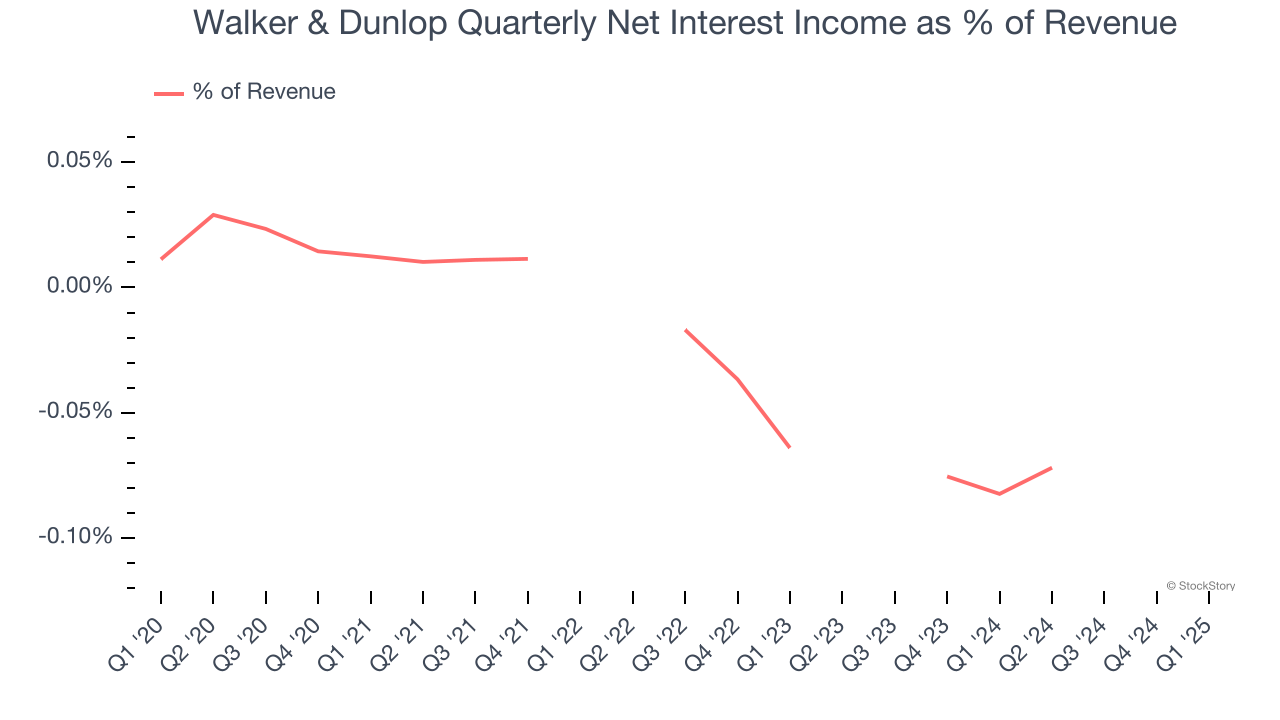 Note: Quarters not shown were determined to be outliers, impacted by outsized investment gains/losses that are not indicative of the recurring fundamentals of the business.
Software is eating the world and there is virtually no industry left that has been untouched by it. That drives increasing demand for tools helping software developers do their jobs, whether it be monitoring critical cloud infrastructure, integrating audio and video functionality, or ensuring smooth content streaming. Click here to access a free report on our 3 favorite stocks to play this generational megatrend.
Key Takeaways from Walker & Dunlop’s Q2 Results
We were impressed by how significantly Walker & Dunlop blew past analysts’ revenue expectations this quarter. On the other hand, its EPS missed. Overall, this was a weaker quarter. The stock traded up 4.2% to $78.64 immediately following the results.
Big picture, is Walker & Dunlop a buy here and now? We think that the latest quarter is only one piece of the longer-term business quality puzzle. Quality, when combined with valuation, can help determine if the stock is a buy. We cover that in our actionable full research report which you can read here, it’s free.