Healthcare apparel company Figs (NYSE: FIGS) reported Q2 CY2025 results beating Wall Street’s revenue expectations, with sales up 5.8% year on year to $152.6 million. Its GAAP profit of $0.04 per share was $0.03 above analysts’ consensus estimates.
Is now the time to buy Figs? Find out by accessing our full research report, it’s free.
Figs (FIGS) Q2 CY2025 Highlights:
- Revenue: $152.6 million vs analyst estimates of $144.7 million (5.8% year-on-year growth, 5.5% beat)
- EPS (GAAP): $0.04 vs analyst estimates of $0.02 ($0.03 beat)
- Adjusted EBITDA: $19.73 million vs analyst estimates of $12.6 million (12.9% margin, 56.5% beat)
- Operating Margin: 6.5%, up from 1.1% in the same quarter last year
- Free Cash Flow was -$13.52 million, down from $7.55 million in the same quarter last year
- Active customers: 2.74 million
- Market Capitalization: $1.06 billion
Company Overview
Rising to fame via TikTok and founded in 2013 by Heather Hasson and Trina Spear, Figs (NYSE: FIGS) is a healthcare apparel company known for its stylish approach to medical attire and uniforms.
Revenue Growth
Examining a company’s long-term performance can provide clues about its quality. Any business can have short-term success, but a top-tier one grows for years. Over the last five years, Figs grew its sales at an incredible 30.3% compounded annual growth rate. Its growth beat the average consumer discretionary company and shows its offerings resonate with customers.
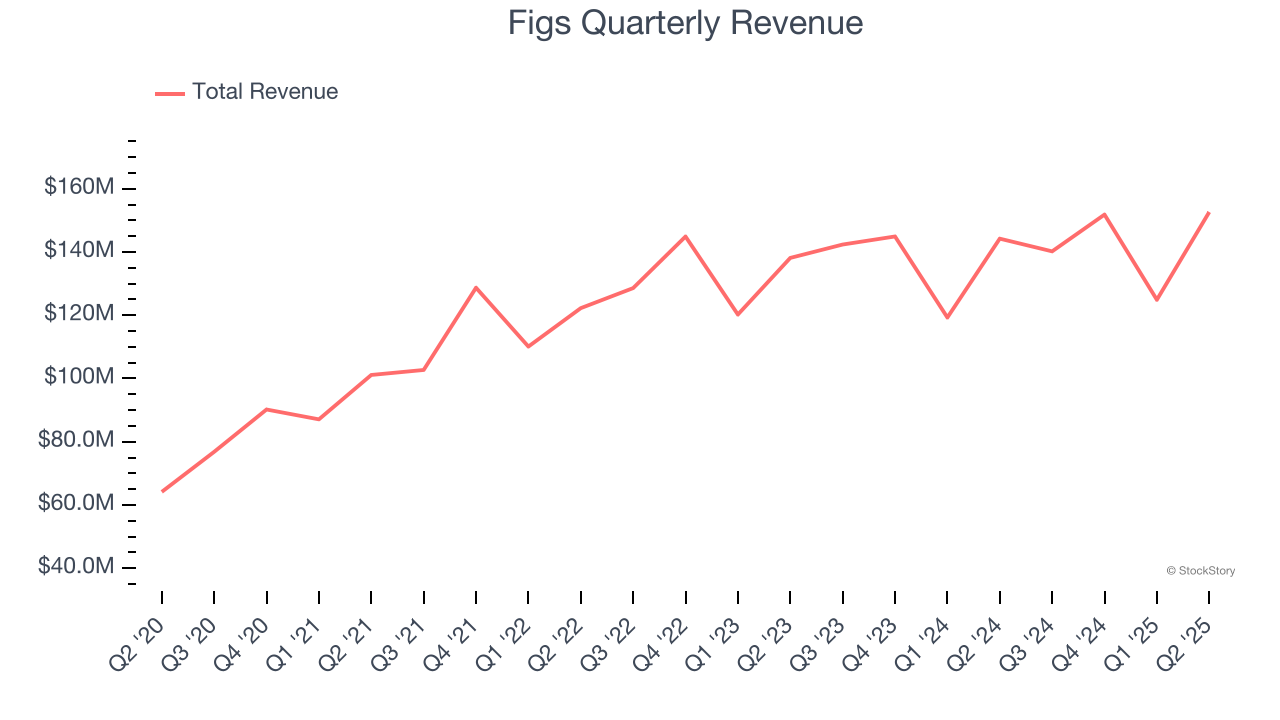
Long-term growth is the most important, but within consumer discretionary, product cycles are short and revenue can be hit-driven due to rapidly changing trends and consumer preferences. Figs’s recent performance shows its demand has slowed significantly as its annualized revenue growth of 3.5% over the last two years was well below its five-year trend. 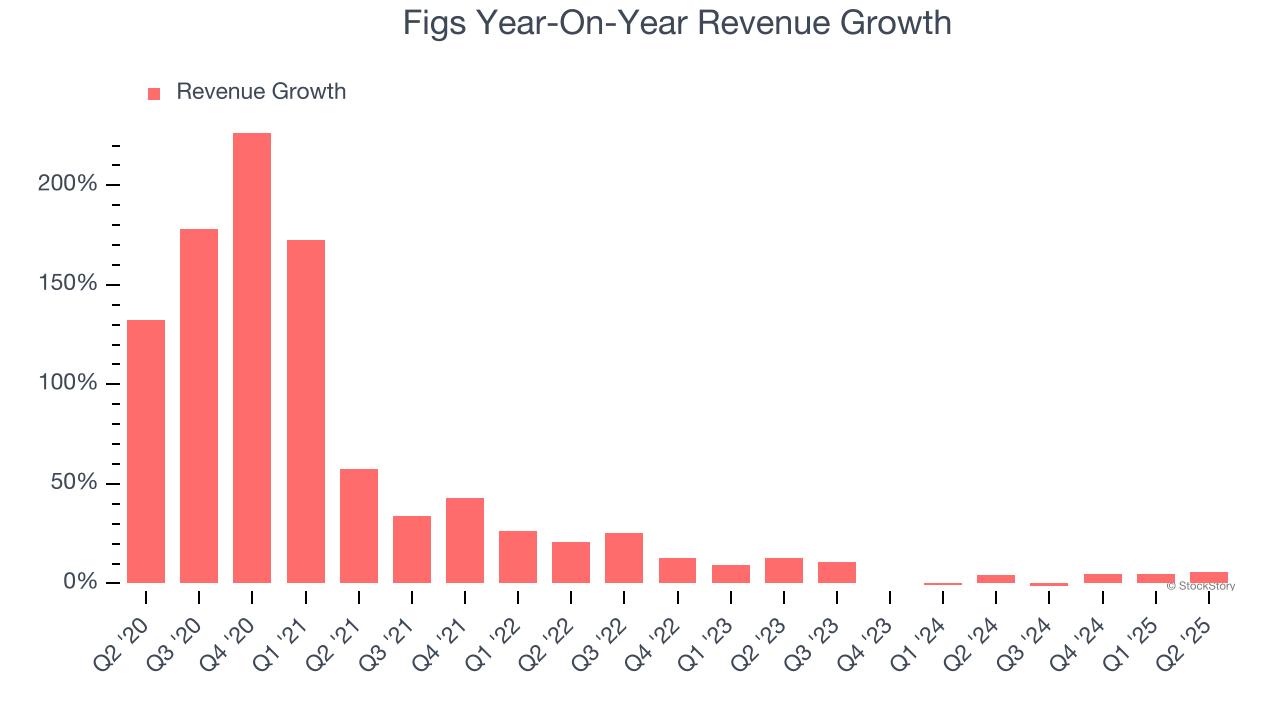
Figs also discloses its number of active customers, which reached 2.74 million in the latest quarter. Over the last two years, Figs’s active customers averaged 7.8% year-on-year growth. Because this number is higher than its revenue growth during the same period, we can see the company’s monetization has fallen. 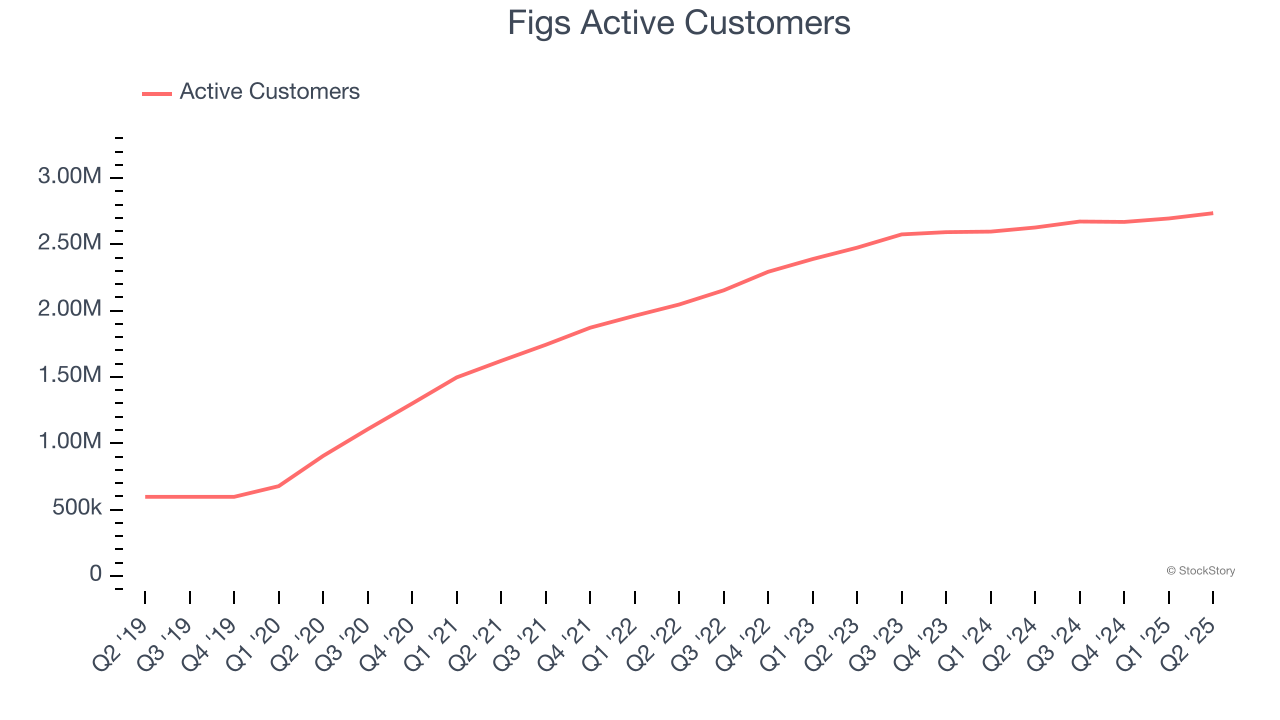
This quarter, Figs reported year-on-year revenue growth of 5.8%, and its $152.6 million of revenue exceeded Wall Street’s estimates by 5.5%.
Looking ahead, sell-side analysts expect revenue to grow 5% over the next 12 months, similar to its two-year rate. While this projection implies its newer products and services will fuel better top-line performance, it is still below average for the sector.
Software is eating the world and there is virtually no industry left that has been untouched by it. That drives increasing demand for tools helping software developers do their jobs, whether it be monitoring critical cloud infrastructure, integrating audio and video functionality, or ensuring smooth content streaming. Click here to access a free report on our 3 favorite stocks to play this generational megatrend.
Operating Margin
Operating margin is a key measure of profitability. Think of it as net income - the bottom line - excluding the impact of taxes and interest on debt, which are less connected to business fundamentals.
Figs’s operating margin has shrunk over the last 12 months and averaged 3.2% over the last two years. Although this result isn’t good, the company’s elite historical revenue growth suggests it ramped up investments to capture market share. We’ll keep a close eye to see if this strategy pays off.
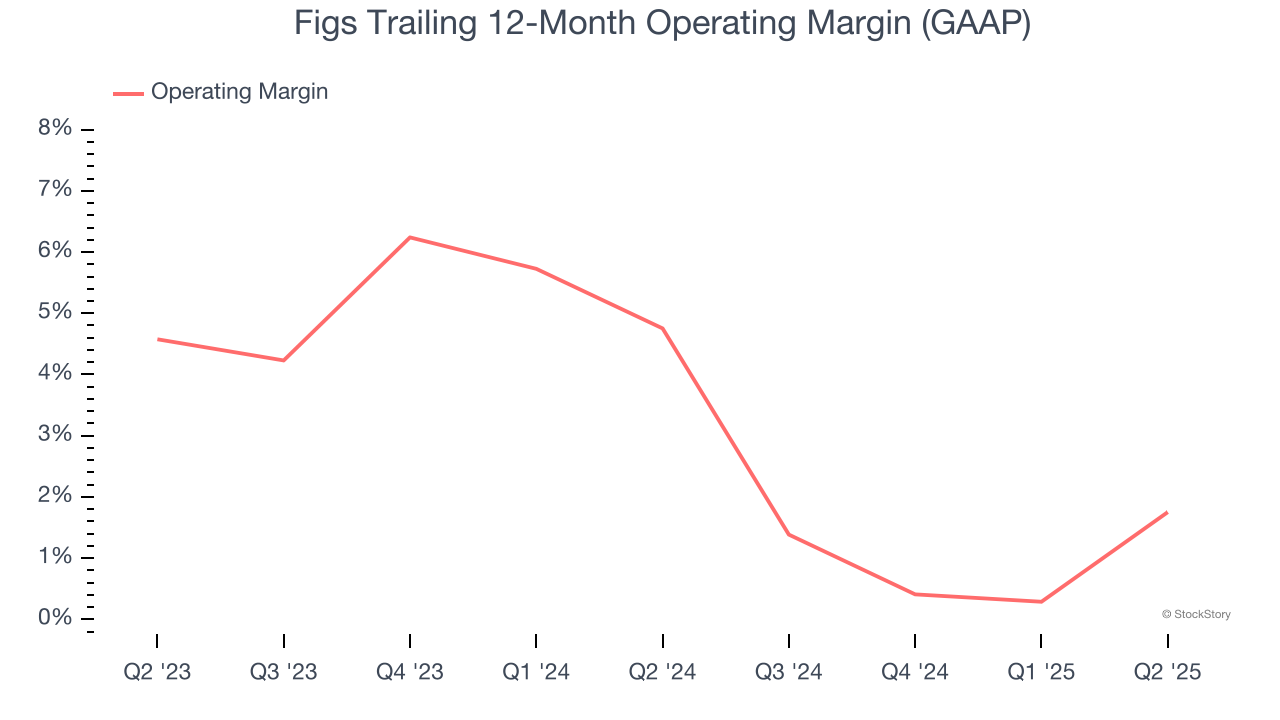
In Q2, Figs generated an operating margin profit margin of 6.5%, up 5.4 percentage points year on year. This increase was a welcome development and shows it was more efficient.
Earnings Per Share
We track the long-term change in earnings per share (EPS) for the same reason as long-term revenue growth. Compared to revenue, however, EPS highlights whether a company’s growth is profitable.
Sadly for Figs, its EPS declined by 34.3% annually over the last five years while its revenue grew by 30.3%. This tells us the company became less profitable on a per-share basis as it expanded.
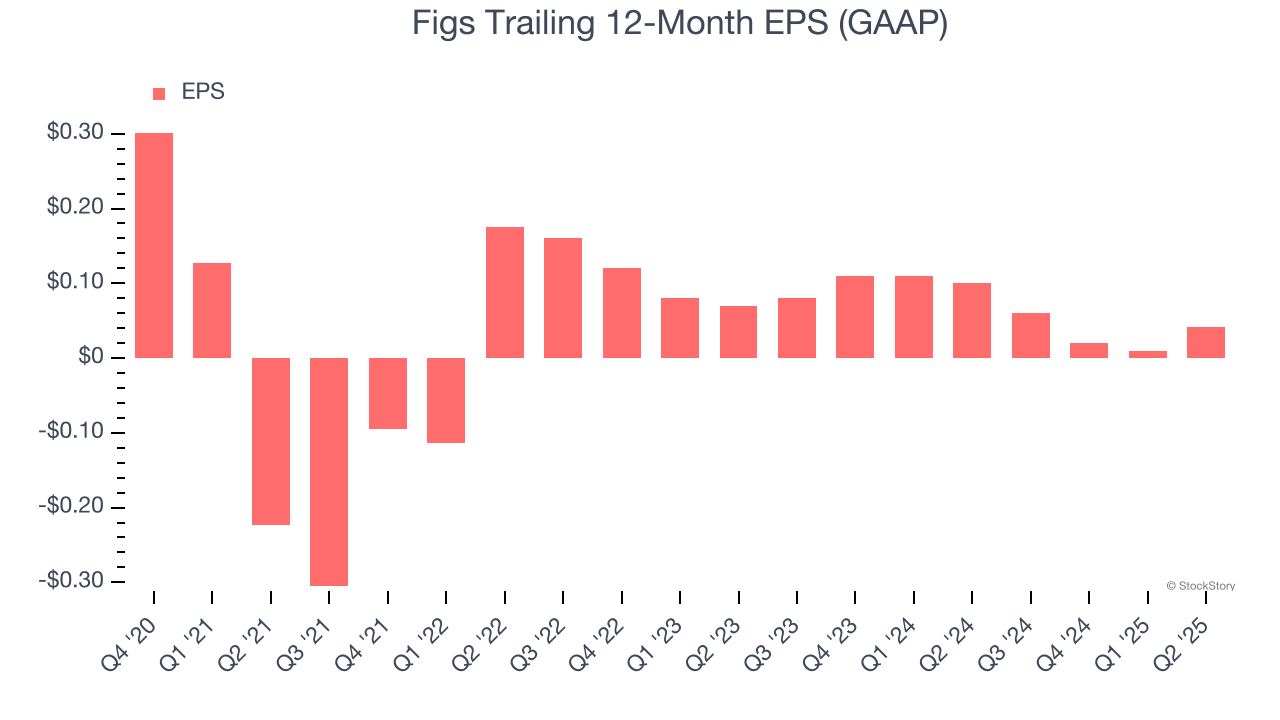
In Q2, Figs reported EPS at $0.04, up from $0.01 in the same quarter last year. This print easily cleared analysts’ estimates, and shareholders should be content with the results. Over the next 12 months, Wall Street expects Figs to perform poorly. Analysts forecast its full-year EPS of $0.04 will hit $0.04.
Key Takeaways from Figs’s Q2 Results
We were impressed by how significantly Figs blew past analysts’ EPS expectations this quarter. We were also excited its EBITDA outperformed Wall Street’s estimates by a wide margin. Zooming out, we think this was a solid print. The stock traded up 12% to $7.35 immediately after reporting.
Indeed, Figs had a rock-solid quarterly earnings result, but is this stock a good investment here? When making that decision, it’s important to consider its valuation, business qualities, as well as what has happened in the latest quarter. We cover that in our actionable full research report which you can read here, it’s free.