
Pop culture collectibles manufacturer Funko (NASDAQ: FNKO) reported revenue ahead of Wall Street’s expectations in Q2 CY2025, but sales fell by 21.9% year on year to $193.5 million. Its non-GAAP loss of $0.48 per share was 11.6% below analysts’ consensus estimates.
Is now the time to buy Funko? Find out by accessing our full research report, it’s free.
Funko (FNKO) Q2 CY2025 Highlights:
- Revenue: $193.5 million vs analyst estimates of $183.9 million (21.9% year-on-year decline, 5.2% beat)
- Adjusted EPS: -$0.48 vs analyst expectations of -$0.43 (11.6% miss)
- Adjusted EBITDA: -$16.53 million vs analyst estimates of -$10.5 million (-8.5% margin, 57.4% miss)
- Operating Margin: -18%, down from 4.3% in the same quarter last year
- Free Cash Flow was -$22.18 million, down from $37.47 million in the same quarter last year
- Market Capitalization: $198.7 million
“As expected, our 2025 second quarter performance was impacted by a dynamic and uncertain tariff environment,” said Mike Lunsford, Interim Chief Executive Officer of Funko.
Company Overview
Boasting partnerships with media franchises like Marvel and One Piece, Funko (NASDAQ: FNKO) is a company specializing in creating and distributing licensed pop culture collectibles.
Revenue Growth
A company’s long-term performance is an indicator of its overall quality. Even a bad business can shine for one or two quarters, but a top-tier one grows for years. Unfortunately, Funko’s 7.6% annualized revenue growth over the last five years was sluggish. This fell short of our benchmark for the consumer discretionary sector and is a rough starting point for our analysis.
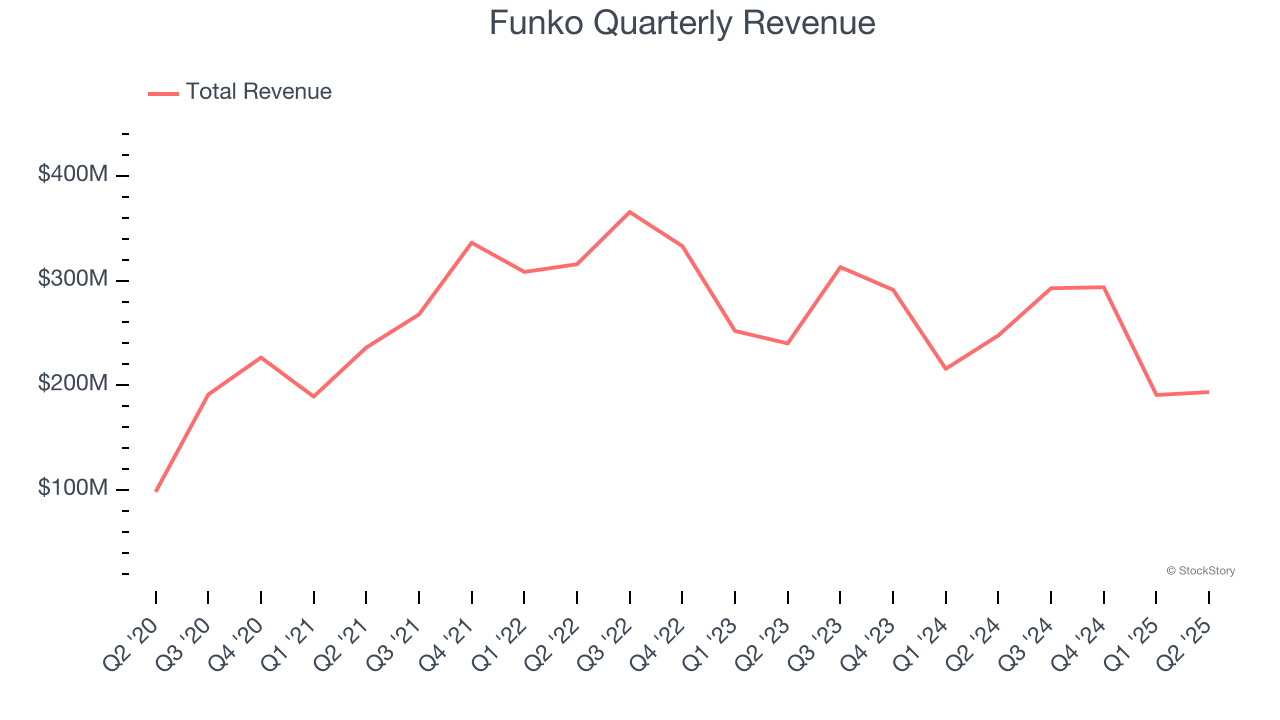
Long-term growth is the most important, but within consumer discretionary, product cycles are short and revenue can be hit-driven due to rapidly changing trends and consumer preferences. Funko’s performance shows it grew in the past but relinquished its gains over the last two years, as its revenue fell by 9.7% annually. 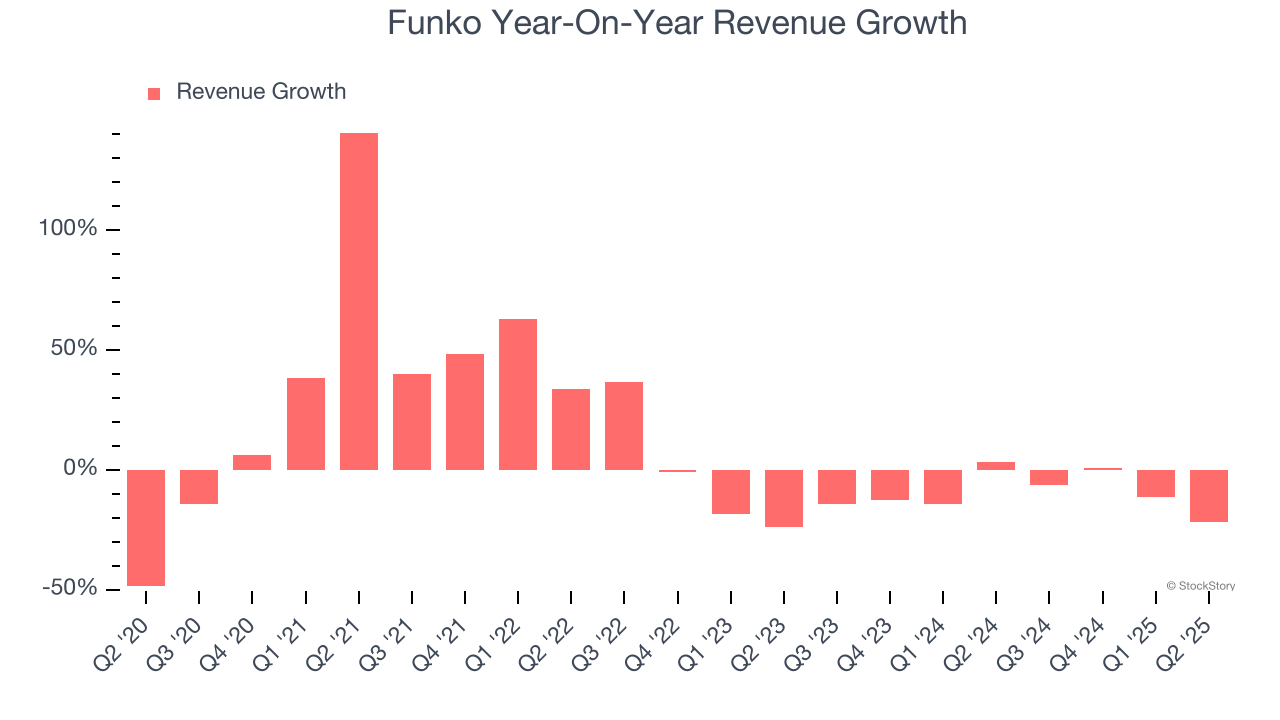
This quarter, Funko’s revenue fell by 21.9% year on year to $193.5 million but beat Wall Street’s estimates by 5.2%.
Looking ahead, sell-side analysts expect revenue to grow 7.5% over the next 12 months. Although this projection indicates its newer products and services will fuel better top-line performance, it is still below the sector average.
Software is eating the world and there is virtually no industry left that has been untouched by it. That drives increasing demand for tools helping software developers do their jobs, whether it be monitoring critical cloud infrastructure, integrating audio and video functionality, or ensuring smooth content streaming. Click here to access a free report on our 3 favorite stocks to play this generational megatrend.
Operating Margin
Operating margin is an important measure of profitability as it shows the portion of revenue left after accounting for all core expenses – everything from the cost of goods sold to advertising and wages. It’s also useful for comparing profitability across companies with different levels of debt and tax rates because it excludes interest and taxes.
Funko’s operating margin has shrunk over the last 12 months and averaged negative 2.6% over the last two years. Unprofitable consumer discretionary companies with falling margins deserve extra scrutiny because they’re spending loads of money to stay relevant, an unsustainable practice.
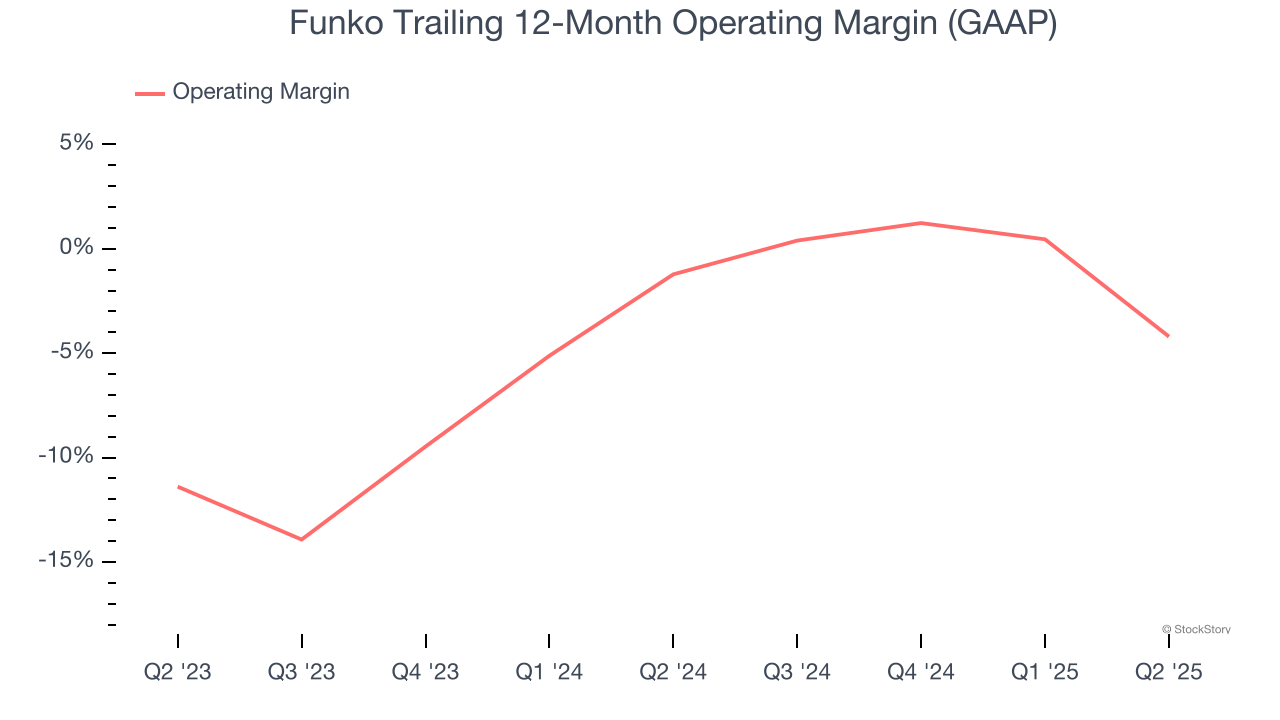
In Q2, Funko generated a negative 18% operating margin. The company's consistent lack of profits raise a flag.
Earnings Per Share
Revenue trends explain a company’s historical growth, but the long-term change in earnings per share (EPS) points to the profitability of that growth – for example, a company could inflate its sales through excessive spending on advertising and promotions.
Sadly for Funko, its EPS declined by 30.9% annually over the last five years while its revenue grew by 7.6%. This tells us the company became less profitable on a per-share basis as it expanded.

In Q2, Funko reported adjusted EPS at negative $0.48, down from $0.10 in the same quarter last year. This print missed analysts’ estimates. Over the next 12 months, Wall Street is optimistic. Analysts forecast Funko’s full-year EPS of negative $0.59 will reach break even.
Key Takeaways from Funko’s Q2 Results
We enjoyed seeing Funko beat analysts’ revenue expectations this quarter. On the other hand, its EBITDA missed and its EPS fell short of Wall Street’s estimates. Overall, this was a softer quarter. The stock traded down 8.7% to $3.34 immediately after reporting.
Funko’s latest earnings report disappointed. One quarter doesn’t define a company’s quality, so let’s explore whether the stock is a buy at the current price. We think that the latest quarter is only one piece of the longer-term business quality puzzle. Quality, when combined with valuation, can help determine if the stock is a buy. We cover that in our actionable full research report which you can read here, it’s free.


