Fast-food chain Wendy’s (NASDAQ: WEN) announced better-than-expected revenue in Q2 CY2025, but sales fell by 1.7% year on year to $560.9 million. Its non-GAAP profit of $0.29 per share was 14% above analysts’ consensus estimates.
Is now the time to buy Wendy's? Find out by accessing our full research report, it’s free.
Wendy's (WEN) Q2 CY2025 Highlights:
- Revenue: $560.9 million vs analyst estimates of $557.6 million (1.7% year-on-year decline, 0.6% beat)
- Adjusted EPS: $0.29 vs analyst estimates of $0.25 (14% beat)
- Adjusted EBITDA: $146.6 million vs analyst estimates of $138.5 million (26.1% margin, 5.8% beat)
- Management lowered its full-year Adjusted EPS guidance to $0.86 at the midpoint, a 10% decrease
- EBITDA guidance for the full year is $515 million at the midpoint, below analyst estimates of $533.1 million
- Operating Margin: 18.6%, up from 17.4% in the same quarter last year
- Free Cash Flow Margin: 7%, up from 5% in the same quarter last year
- Same-Store Sales rose 1.8% year on year, in line with the same quarter last year
- Market Capitalization: $1.91 billion
"In the second quarter we continued to expand our global footprint, adding 44 new restaurants, bringing our total additions to 118 in the first half of the year," said Ken Cook, Interim CEO.
Company Overview
Founded by Dave Thomas in 1969, Wendy’s (NASDAQ: WEN) is a renowned fast-food chain known for its fresh, never-frozen beef burgers, flavorful menu options, and commitment to quality.
Revenue Growth
A company’s long-term sales performance can indicate its overall quality. Any business can put up a good quarter or two, but the best consistently grow over the long haul.
With $2.23 billion in revenue over the past 12 months, Wendy's is a mid-sized restaurant chain, which sometimes brings disadvantages compared to larger competitors benefiting from better brand awareness and economies of scale.
As you can see below, Wendy's grew its sales at a tepid 5.2% compounded annual growth rate over the last six years (we compare to 2019 to normalize for COVID-19 impacts) as it barely increased sales at existing, established dining locations.
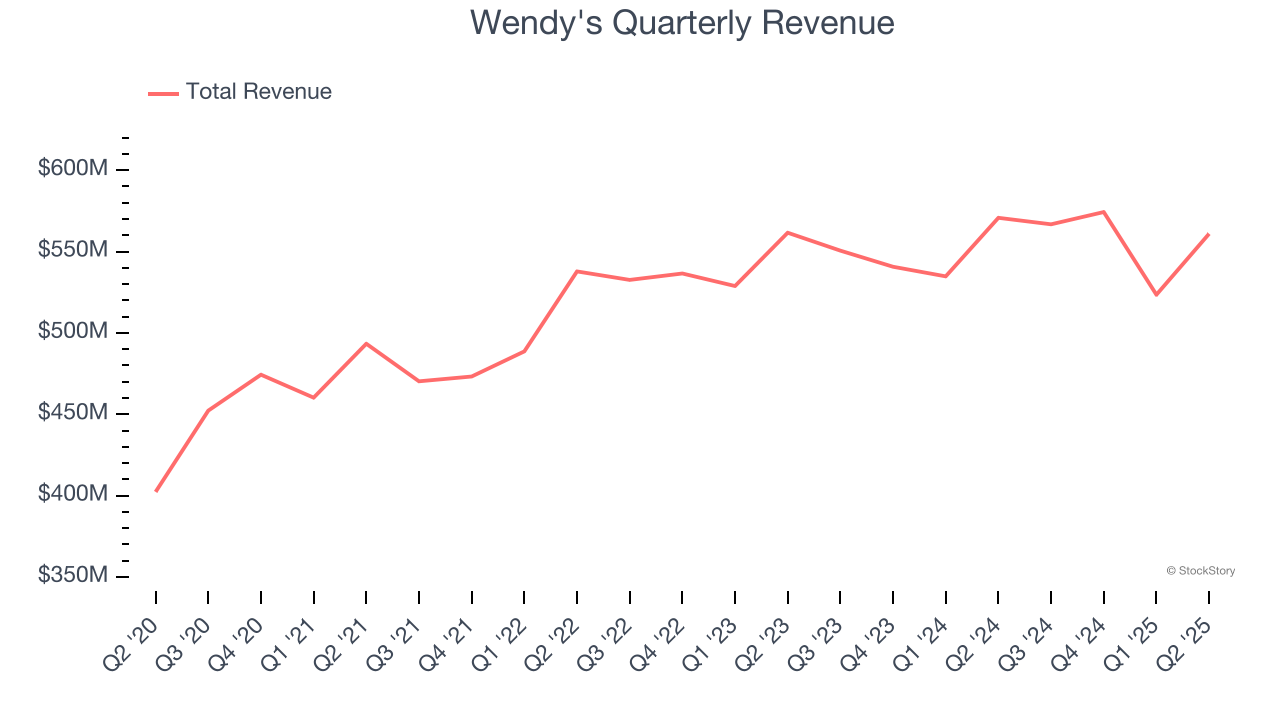
This quarter, Wendy’s revenue fell by 1.7% year on year to $560.9 million but beat Wall Street’s estimates by 0.6%.
Looking ahead, sell-side analysts expect revenue to remain flat over the next 12 months, a deceleration versus the last six years. This projection is underwhelming and suggests its menu offerings will see some demand headwinds.
Software is eating the world and there is virtually no industry left that has been untouched by it. That drives increasing demand for tools helping software developers do their jobs, whether it be monitoring critical cloud infrastructure, integrating audio and video functionality, or ensuring smooth content streaming. Click here to access a free report on our 3 favorite stocks to play this generational megatrend.
Restaurant Performance
Number of Restaurants
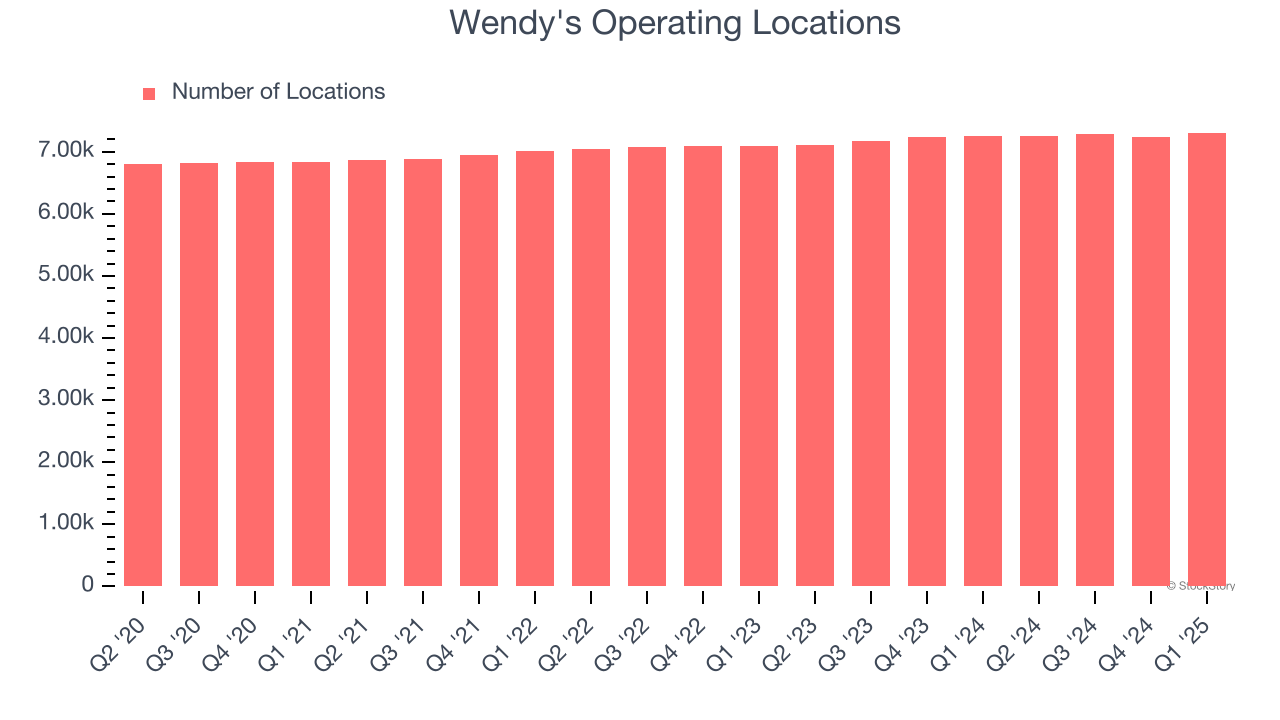
A restaurant chain’s total number of dining locations influences how much it can sell and how quickly revenue can grow.
Over the last two years, Wendy's opened new restaurants quickly, averaging 1.4% annual growth. This was faster than the broader restaurant sector.
When a chain opens new restaurants, it usually means it’s investing for growth because there’s healthy demand for its meals and there are markets where its concepts have few or no locations.
Note that Wendy's reports its restaurant count intermittently, so some data points are missing in the chart below.
Same-Store Sales
A company's restaurant base only paints one part of the picture. When demand is high, it makes sense to open more. But when demand is low, it’s prudent to close some locations and use the money in other ways. Same-store sales provides a deeper understanding of this issue because it measures organic growth at restaurants open for at least a year.
Wendy’s demand within its existing dining locations has been relatively stable over the last two years but was below most restaurant chains. On average, the company’s same-store sales have grown by 1.2% per year. This performance suggests it should consider improving its foot traffic and efficiency before expanding its restaurant base.
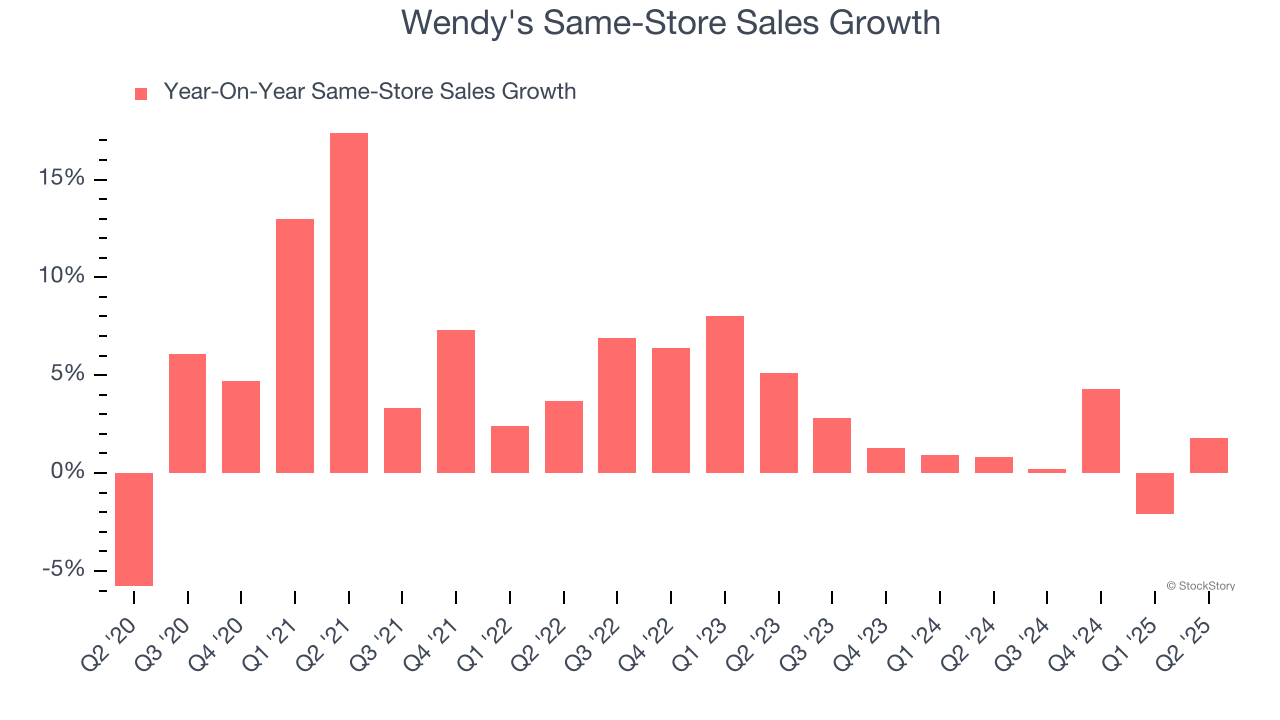
In the latest quarter, Wendy’s same-store sales rose 1.8% year on year. This performance was more or less in line with its historical levels.
Key Takeaways from Wendy’s Q2 Results
We were impressed by how significantly Wendy's blew past analysts’ same-store sales expectations this quarter. We were also glad its EBITDA outperformed Wall Street’s estimates. On the other hand, its full-year EBITDA guidance missed. Overall, we think this was a solid quarter with some key areas of upside. The market seemed to be hoping for more, and the stock traded down 1.2% to $9.85 immediately following the results.
Big picture, is Wendy's a buy here and now? If you’re making that decision, you should consider the bigger picture of valuation, business qualities, as well as the latest earnings. We cover that in our actionable full research report which you can read here, it’s free.