Provident Financial Services has followed the market’s trajectory closely, rising in tandem with the S&P 500 over the past six months. The stock has climbed by 21.4% to $19.85 per share while the index has gained 17.4%.
Is now the time to buy Provident Financial Services, or should you be careful about including it in your portfolio? Get the full stock story straight from our expert analysts, it’s free.
Why Is Provident Financial Services Not Exciting?
We're sitting this one out for now. Here are three reasons we avoid PFS and a stock we'd rather own.
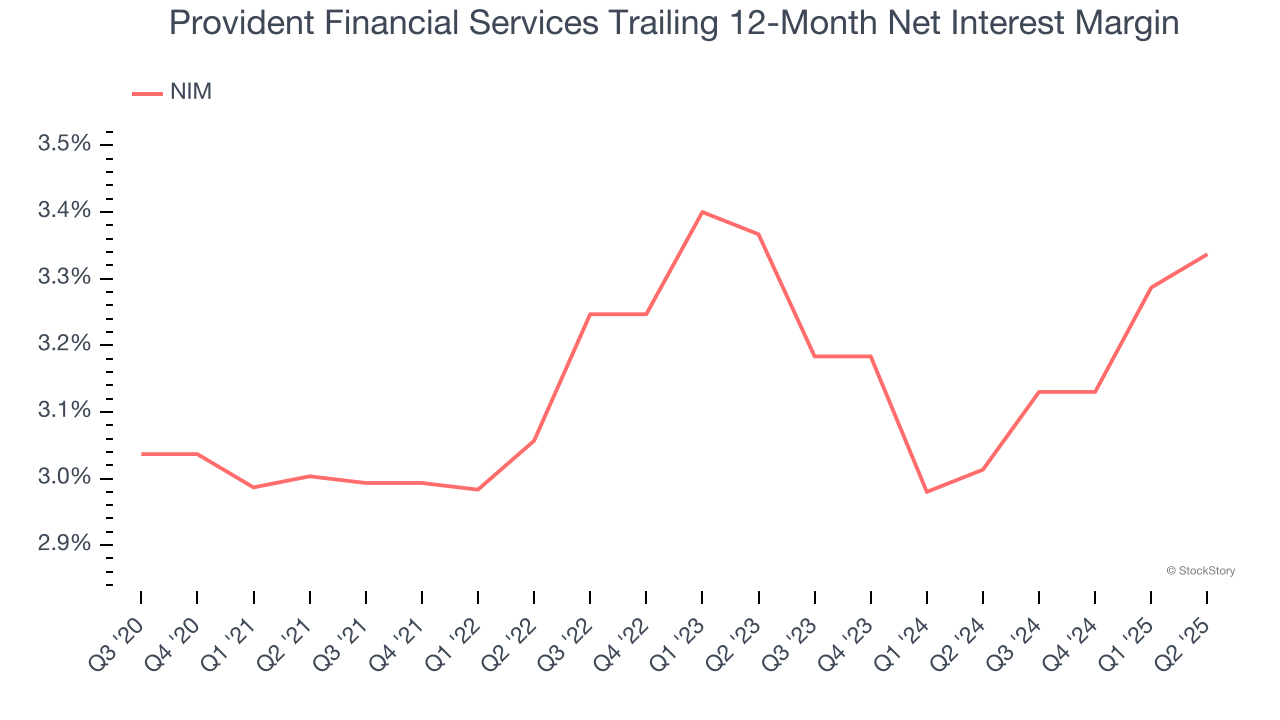
1. Low Net Interest Margin Reveals Weak Loan Book Profitability
The net interest margin (NIM) is a key profitability indicator that measures the difference between what a bank earns on its loans and what it pays on its deposits. This metric measures how efficiently one can generate income from its core lending activities.
Over the past two years, we can see that Provident Financial Services’s net interest margin averaged a subpar 3.2%, reflecting its high servicing and capital costs.
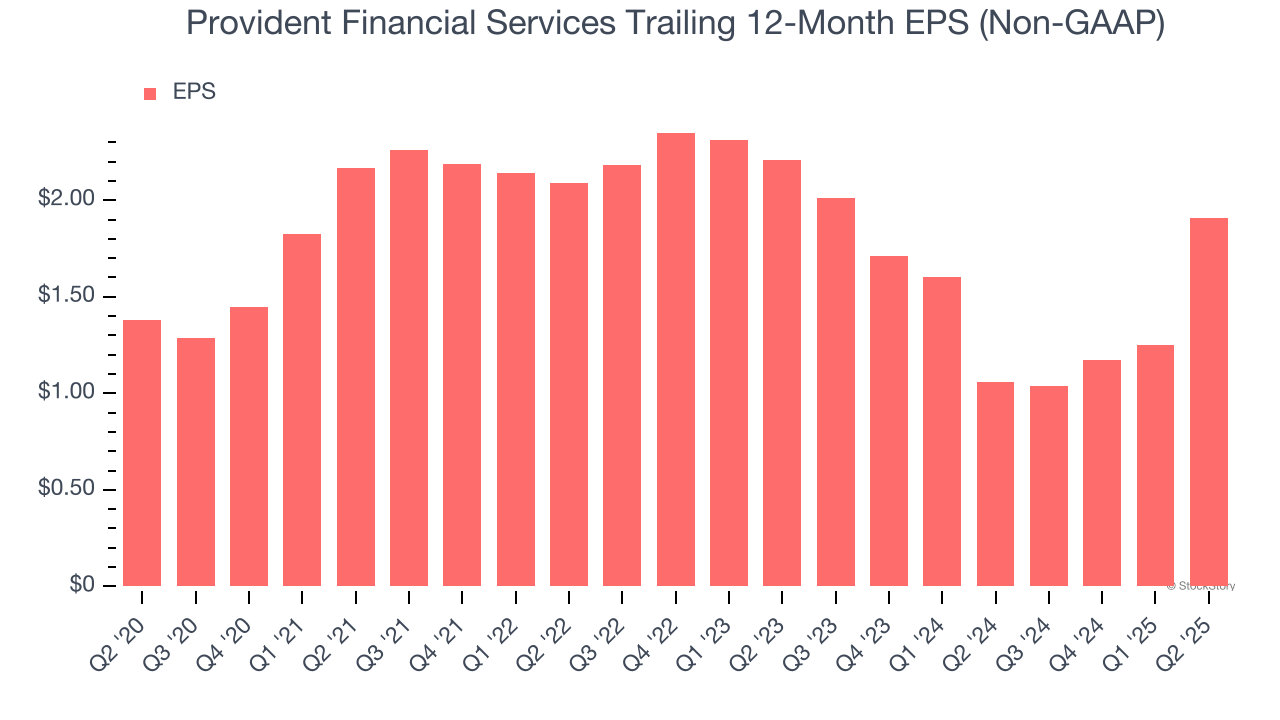
2. EPS Took a Dip Over the Last Two Years
While long-term earnings trends give us the big picture, we also track EPS over a shorter period because it can provide insight into an emerging theme or development for the business.
Sadly for Provident Financial Services, its EPS declined by 7.1% annually over the last two years while its revenue grew by 27.1%. This tells us the company became less profitable on a per-share basis as it expanded.
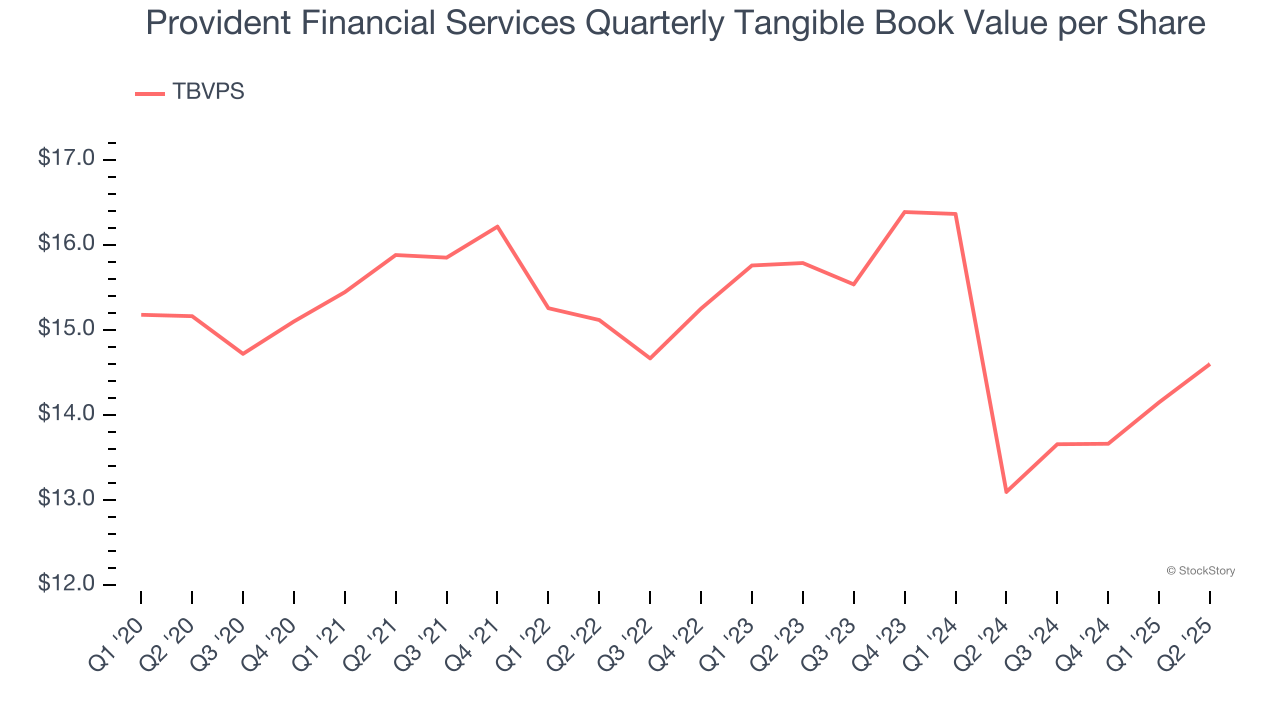
3. Declining TBVPS Reflects Erosion of Asset Value
For banks, tangible book value per share (TBVPS) is a crucial metric that measures the actual value of shareholders’ equity, stripping out goodwill and other intangible assets that may not be recoverable in a worst-case scenario.
Provident Financial Services’s TBVPS was flat over the last five years, and the past two years paint an even worse picture as TBVPS declined at a -3.8% annual clip (from $15.79 to $14.60 per share).
Final Judgment
Provident Financial Services isn’t a terrible business, but it isn’t one of our picks. That said, the stock currently trades at 0.9× forward P/B (or $19.85 per share). While this valuation is reasonable, we don’t really see a big opportunity at the moment. We're fairly confident there are better stocks to buy right now. We’d suggest looking at the most entrenched endpoint security platform on the market.
Stocks We Would Buy Instead of Provident Financial Services
Trump’s April 2025 tariff bombshell triggered a massive market selloff, but stocks have since staged an impressive recovery, leaving those who panic sold on the sidelines.
Take advantage of the rebound by checking out our Top 9 Market-Beating Stocks. This is a curated list of our High Quality stocks that have generated a market-beating return of 183% over the last five years (as of March 31st 2025).
Stocks that made our list in 2020 include now familiar names such as Nvidia (+1,545% between March 2020 and March 2025) as well as under-the-radar businesses like the once-micro-cap company Kadant (+351% five-year return). Find your next big winner with StockStory today.
StockStory is growing and hiring equity analyst and marketing roles. Are you a 0 to 1 builder passionate about the markets and AI? See the open roles here.