Over the past six months, GEO Group’s shares (currently trading at $23.20) have posted a disappointing 10.5% loss, well below the S&P 500’s 17.7% gain. This was partly driven by its softer quarterly results and might have investors contemplating their next move.
Is now the time to buy GEO Group, or should you be careful about including it in your portfolio? See what our analysts have to say in our full research report, it’s free.
Why Do We Think GEO Group Will Underperform?
Even though the stock has become cheaper, we're sitting this one out for now. Here are three reasons there are better opportunities than GEO and a stock we'd rather own.
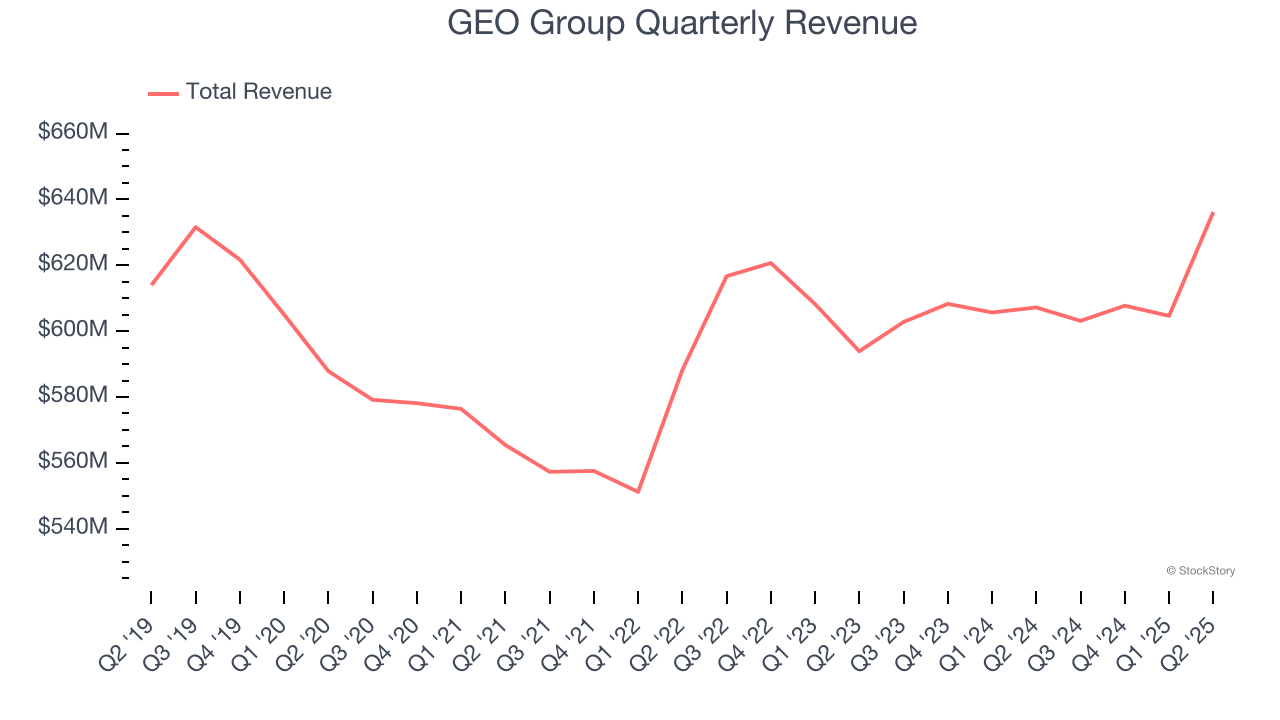
1. Long-Term Revenue Growth Flatter Than a Pancake
A company’s long-term sales performance can indicate its overall quality. Even a bad business can shine for one or two quarters, but a top-tier one grows for years. Unfortunately, GEO Group struggled to consistently increase demand as its $2.45 billion of sales for the trailing 12 months was close to its revenue five years ago. This wasn’t a great result and signals it’s a low quality business.
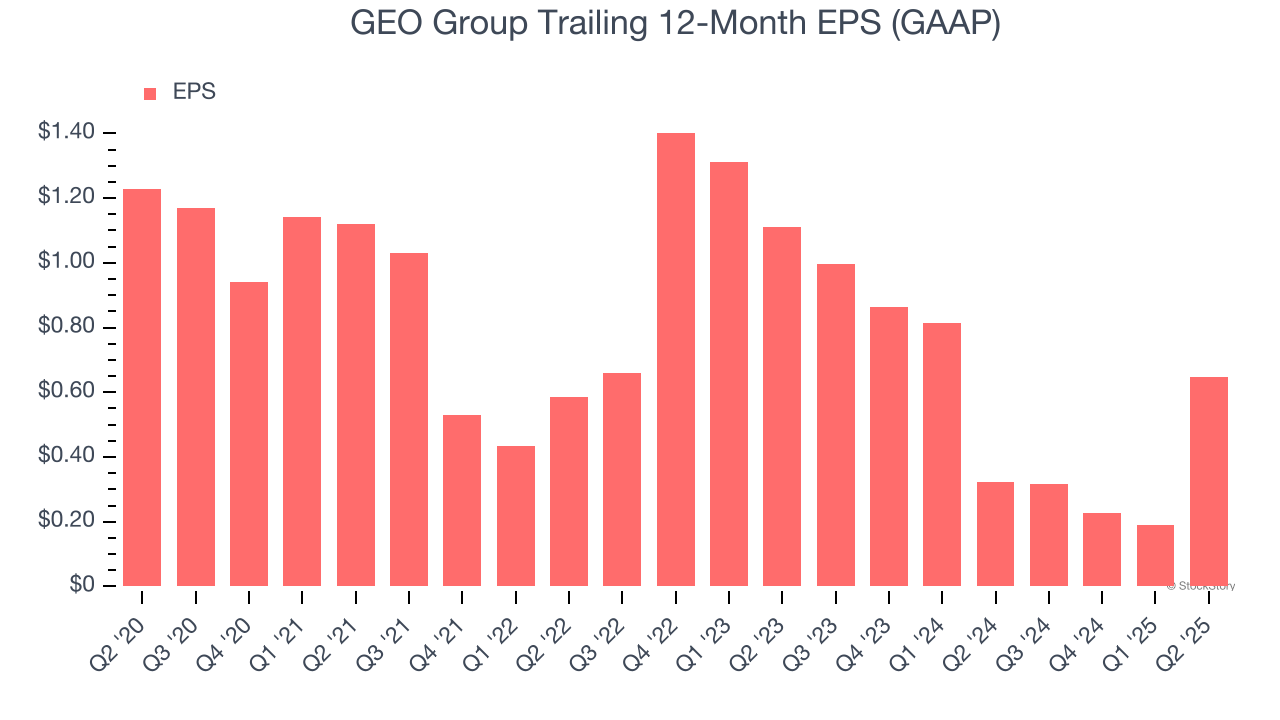
2. EPS Trending Down
We track the long-term change in earnings per share (EPS) because it highlights whether a company’s growth is profitable.
Sadly for GEO Group, its EPS declined by 12% annually over the last five years while its revenue was flat. This tells us the company struggled because its fixed cost base made it difficult to adjust to choppy demand.
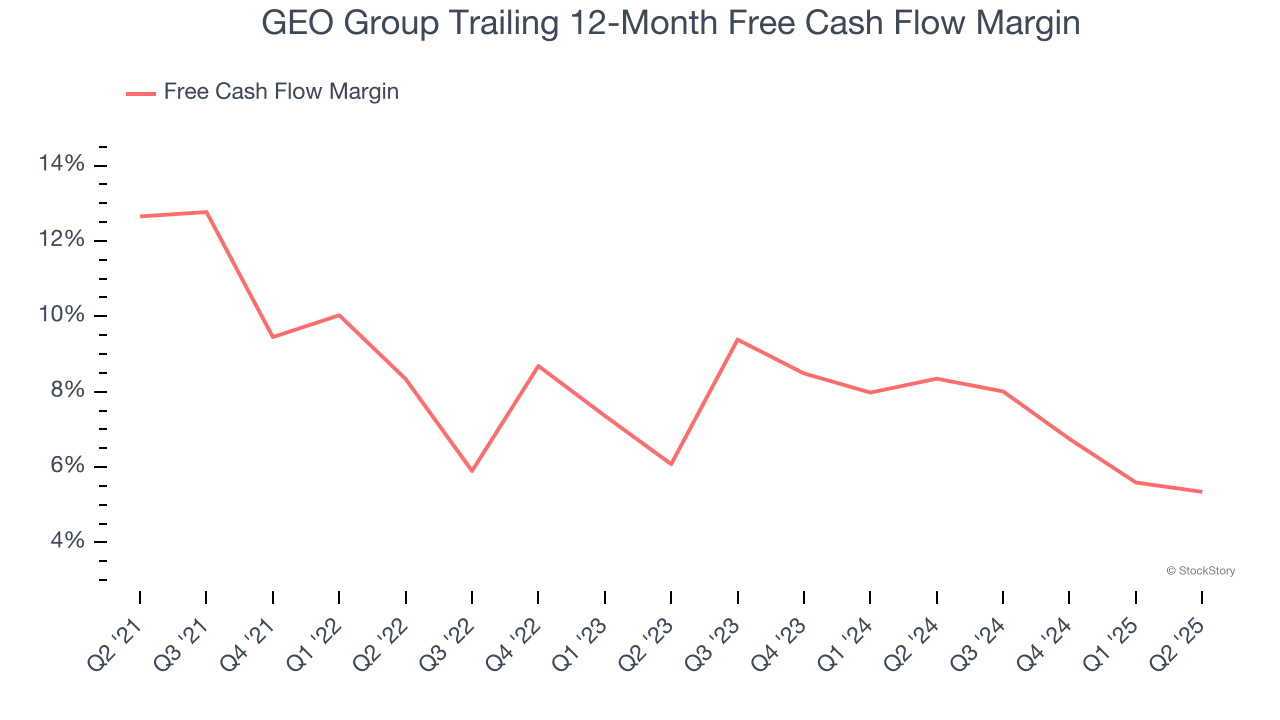
3. Free Cash Flow Margin Dropping
If you’ve followed StockStory for a while, you know we emphasize free cash flow. Why, you ask? We believe that in the end, cash is king, and you can’t use accounting profits to pay the bills.
As you can see below, GEO Group’s margin dropped by 7.3 percentage points over the last five years. If its declines continue, it could signal increasing investment needs and capital intensity. GEO Group’s free cash flow margin for the trailing 12 months was 5.3%.
Final Judgment
We cheer for all companies making their customers lives easier, but in the case of GEO Group, we’ll be cheering from the sidelines. Following the recent decline, the stock trades at 12.3× forward P/E (or $23.20 per share). This valuation tells us it’s a bit of a market darling with a lot of good news priced in - we think there are better stocks to buy right now. Let us point you toward the most dominant software business in the world.
High-Quality Stocks for All Market Conditions
Donald Trump’s April 2025 "Liberation Day" tariffs sent markets into a tailspin, but stocks have since rebounded strongly, proving that knee-jerk reactions often create the best buying opportunities.
The smart money is already positioning for the next leg up. Don’t miss out on the recovery - check out our Top 5 Growth Stocks for this month. This is a curated list of our High Quality stocks that have generated a market-beating return of 183% over the last five years (as of March 31st 2025).
Stocks that made our list in 2020 include now familiar names such as Nvidia (+1,545% between March 2020 and March 2025) as well as under-the-radar businesses like the once-micro-cap company Kadant (+351% five-year return). Find your next big winner with StockStory today.
StockStory is growing and hiring equity analyst and marketing roles. Are you a 0 to 1 builder passionate about the markets and AI? See the open roles here.