
Educational publishing and media company Scholastic (NASDAQ: SCHL) missed Wall Street’s revenue expectations in Q3 CY2025, with sales falling 4.9% year on year to $225.6 million. Its non-GAAP loss of $2.52 per share was 4.6% below analysts’ consensus estimates.
Is now the time to buy Scholastic? Find out by accessing our full research report, it’s free.
Scholastic (SCHL) Q3 CY2025 Highlights:
- Revenue: $225.6 million vs analyst estimates of $238.9 million (4.9% year-on-year decline, 5.6% miss)
- Adjusted EPS: -$2.52 vs analyst expectations of -$2.41 (4.6% miss)
- Adjusted EBITDA: -$55.7 million vs analyst estimates of -$62.76 million (-24.7% margin, 11.3% beat)
- EBITDA guidance for the full year is $165 million at the midpoint, above analyst estimates of $163.3 million
- Operating Margin: -40.9%, down from -36.2% in the same quarter last year
- Free Cash Flow was -$100.2 million compared to -$68.7 million in the same quarter last year
- Market Capitalization: $683 million
Peter Warwick, President and Chief Executive Officer, said, "Scholastic made steady progress in the first quarter of fiscal 2026, advancing strategic initiatives across all segments. The seasonally quiet summer period resulted in an operating loss consistent with expectations.
Company Overview
Creator of the legendary Scholastic Book Fair, Scholastic (NASDAQ: SCHL) is an international company specializing in children's publishing, education, and media services.
Revenue Growth
A company’s long-term sales performance can indicate its overall quality. Any business can put up a good quarter or two, but many enduring ones grow for years. Regrettably, Scholastic’s sales grew at a weak 1.9% compounded annual growth rate over the last five years. This was below our standards and is a rough starting point for our analysis.
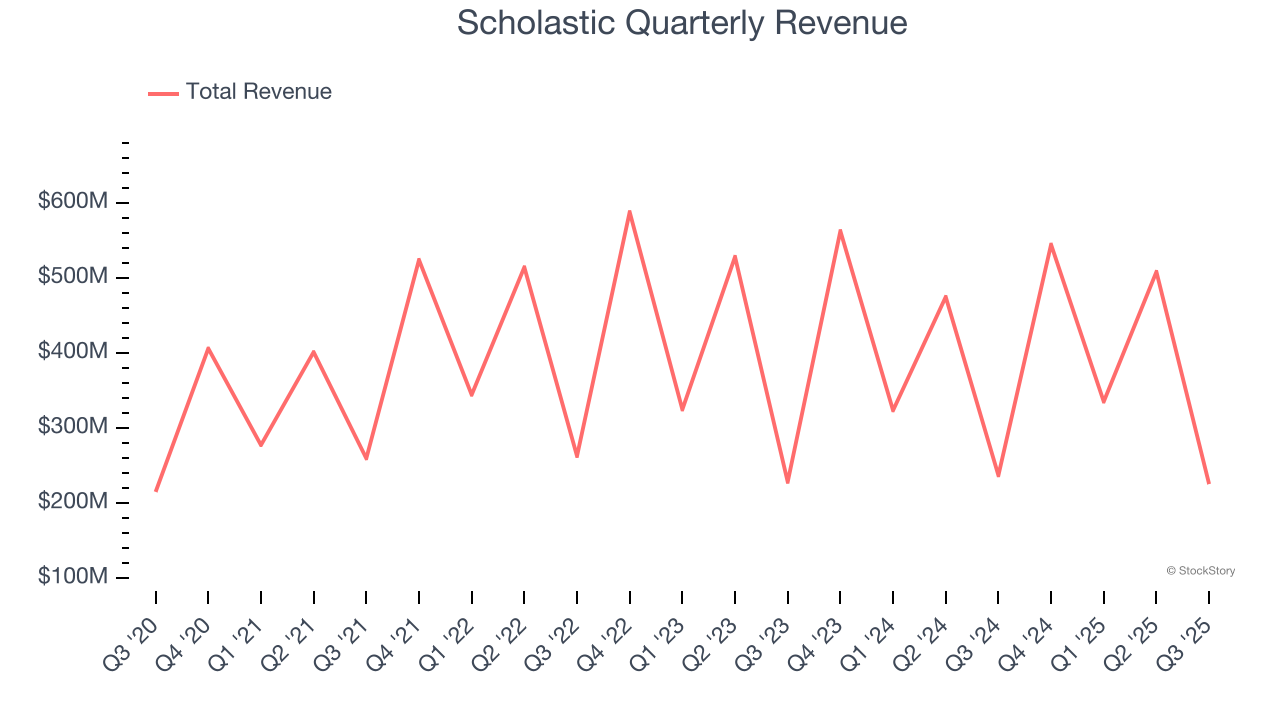
We at StockStory place the most emphasis on long-term growth, but within consumer discretionary, a stretched historical view may miss a company riding a successful new product or trend. Scholastic’s performance shows it grew in the past but relinquished its gains over the last two years, as its revenue fell by 1.7% annually. 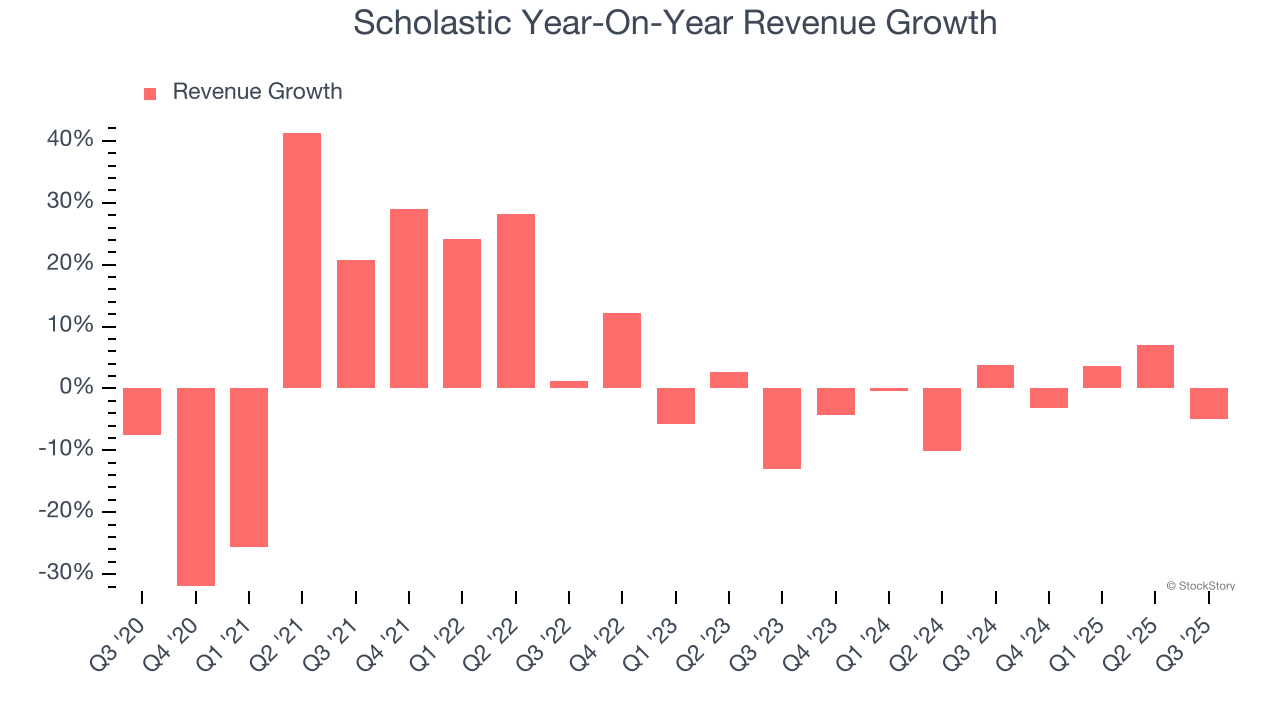
This quarter, Scholastic missed Wall Street’s estimates and reported a rather uninspiring 4.9% year-on-year revenue decline, generating $225.6 million of revenue.
Looking ahead, sell-side analysts expect revenue to grow 2.4% over the next 12 months. While this projection implies its newer products and services will spur better top-line performance, it is still below average for the sector.
Software is eating the world and there is virtually no industry left that has been untouched by it. That drives increasing demand for tools helping software developers do their jobs, whether it be monitoring critical cloud infrastructure, integrating audio and video functionality, or ensuring smooth content streaming. Click here to access a free report on our 3 favorite stocks to play this generational megatrend.
Operating Margin
Operating margin is an important measure of profitability as it shows the portion of revenue left after accounting for all core expenses – everything from the cost of goods sold to advertising and wages. It’s also useful for comparing profitability across companies with different levels of debt and tax rates because it excludes interest and taxes.
Scholastic’s operating margin might fluctuated slightly over the last 12 months but has remained more or less the same, averaging 2% over the last two years. This profitability was lousy for a consumer discretionary business and caused by its suboptimal cost structure.
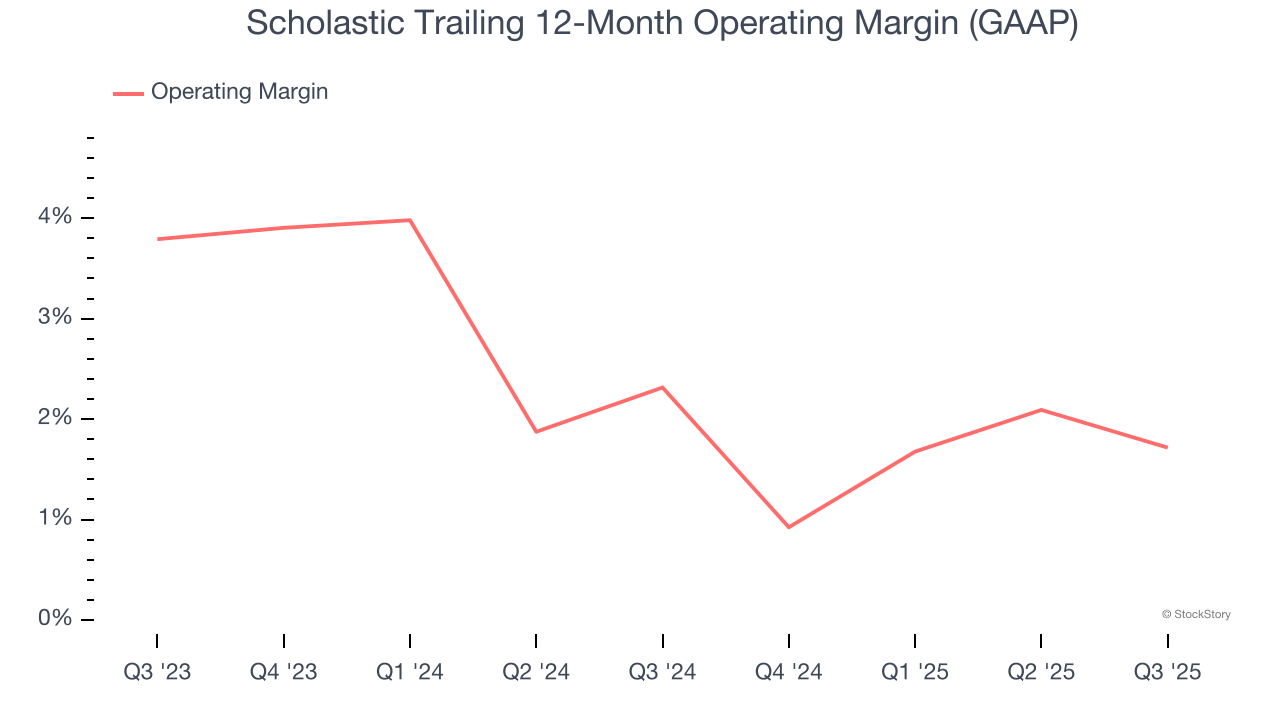
In Q3, Scholastic generated an operating margin profit margin of negative 40.9%, down 4.7 percentage points year on year. This contraction shows it was less efficient because its expenses increased relative to its revenue.
Earnings Per Share
Revenue trends explain a company’s historical growth, but the long-term change in earnings per share (EPS) points to the profitability of that growth – for example, a company could inflate its sales through excessive spending on advertising and promotions.
Scholastic’s EPS grew at an unimpressive 8% compounded annual growth rate over the last five years. This performance was better than its flat revenue but doesn’t tell us much about its business quality because its operating margin didn’t improve.
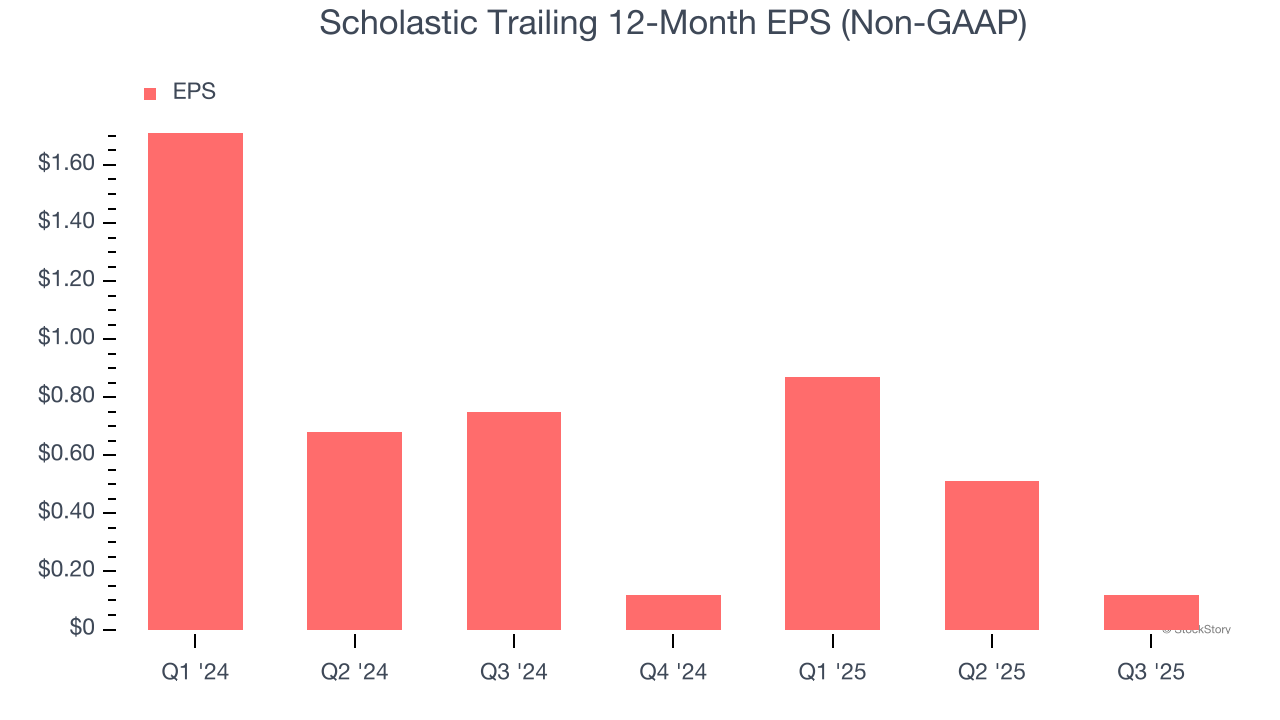
In Q3, Scholastic reported adjusted EPS of negative $2.52, down from negative $2.13 in the same quarter last year. This print missed analysts’ estimates. We also like to analyze expected EPS growth based on Wall Street analysts’ consensus projections, but there is insufficient data.
Key Takeaways from Scholastic’s Q3 Results
It was encouraging to see Scholastic beat analysts’ EBITDA expectations this quarter. We were also glad its full-year EBITDA guidance slightly exceeded Wall Street’s estimates. On the other hand, its revenue missed and its EPS fell short of Wall Street’s estimates. Overall, this was a weaker quarter. The stock traded down 12.2% to $24.29 immediately after reporting.
The latest quarter from Scholastic’s wasn’t that good. One earnings report doesn’t define a company’s quality, though, so let’s explore whether the stock is a buy at the current price. What happened in the latest quarter matters, but not as much as longer-term business quality and valuation, when deciding whether to invest in this stock. We cover that in our actionable full research report which you can read here, it’s free.


