
Stride trades at $143 per share and has stayed right on track with the overall market, gaining 17.8% over the last six months. At the same time, the S&P 500 has returned 16.8%.
Is LRN a buy right now? Find out in our full research report, it’s free.
Why Are We Positive On LRN?
Formerly known as K12, Stride (NYSE: LRN) is an education technology company providing education solutions through digital platforms.
1. Growth in Enrollments Shows Increasing Demand
Revenue growth can be broken down into changes in price and volume (for companies like Stride, our preferred volume metric is enrollments). While both are important, the latter is the most critical to analyze because prices have a ceiling.
Stride’s enrollments punched in at 235,300 in the latest quarter, and over the last two years, averaged 14.6% year-on-year growth. This performance was fantastic and shows its services have a unique value proposition. 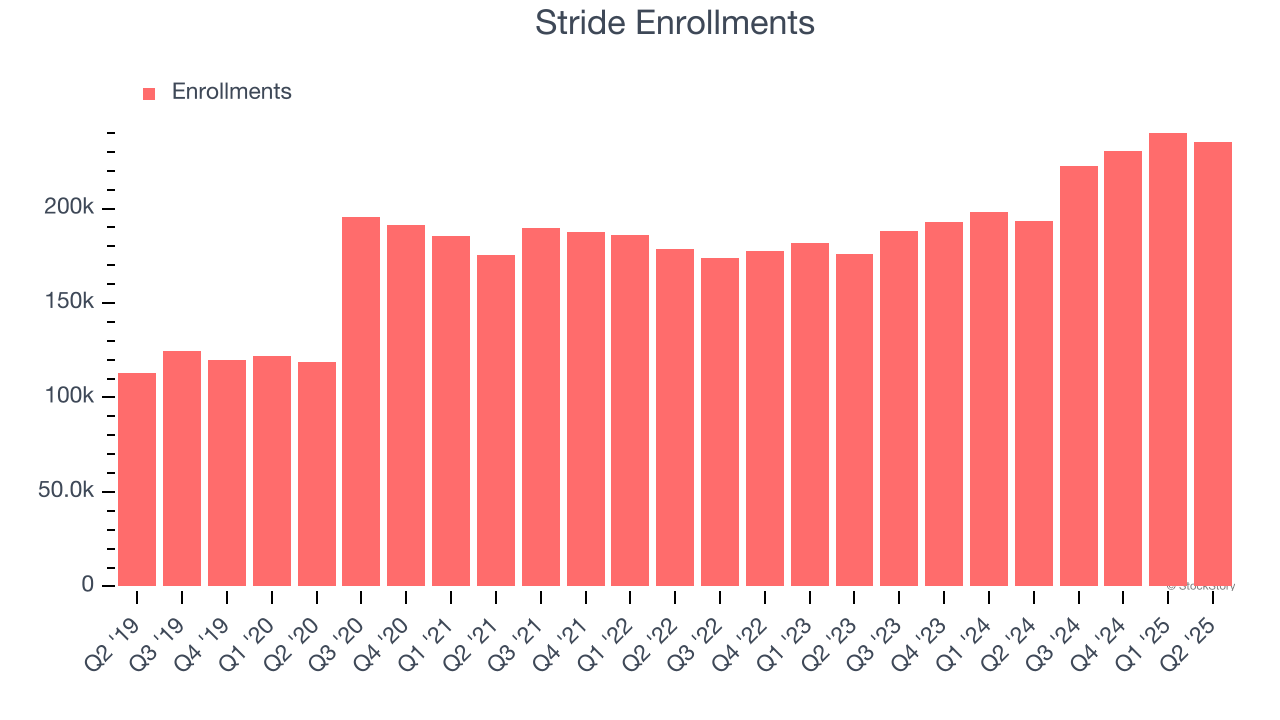
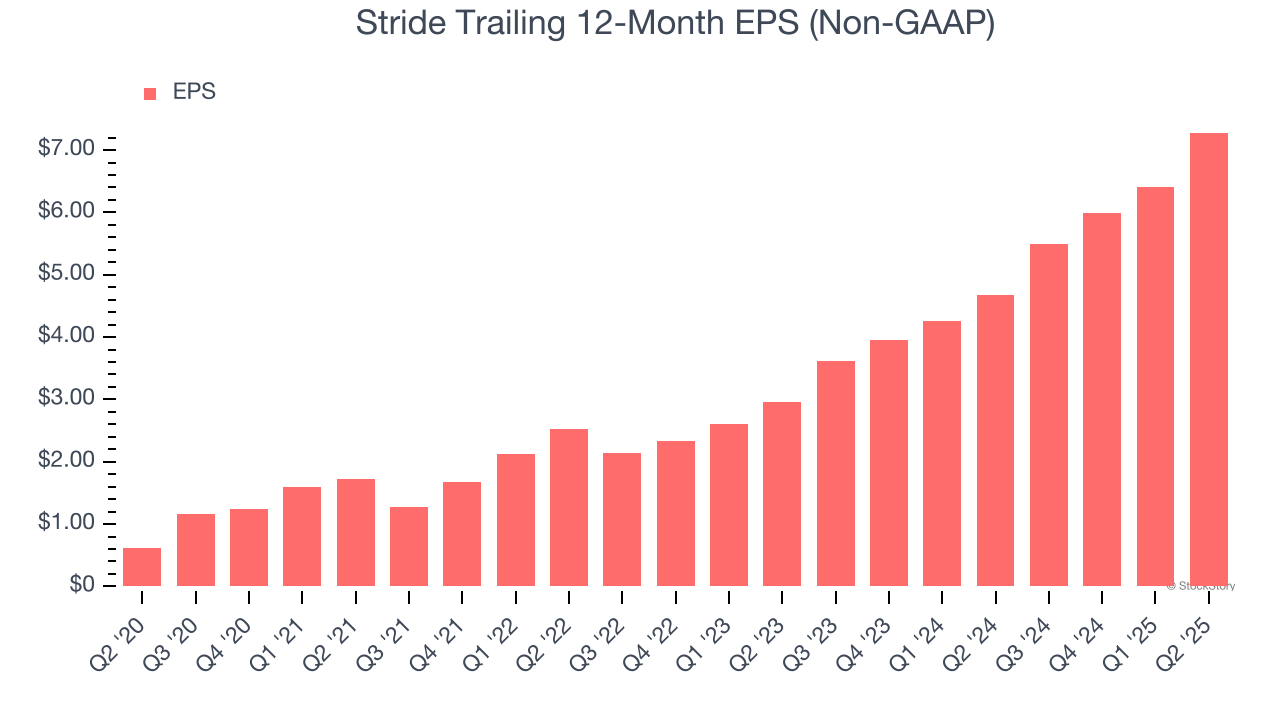
2. Outstanding Long-Term EPS Growth
Analyzing the long-term change in earnings per share (EPS) shows whether a company's incremental sales were profitable – for example, revenue could be inflated through excessive spending on advertising and promotions.
Stride’s EPS grew at an astounding 64.2% compounded annual growth rate over the last five years, higher than its 18.2% annualized revenue growth. This tells us the company became more profitable on a per-share basis as it expanded.
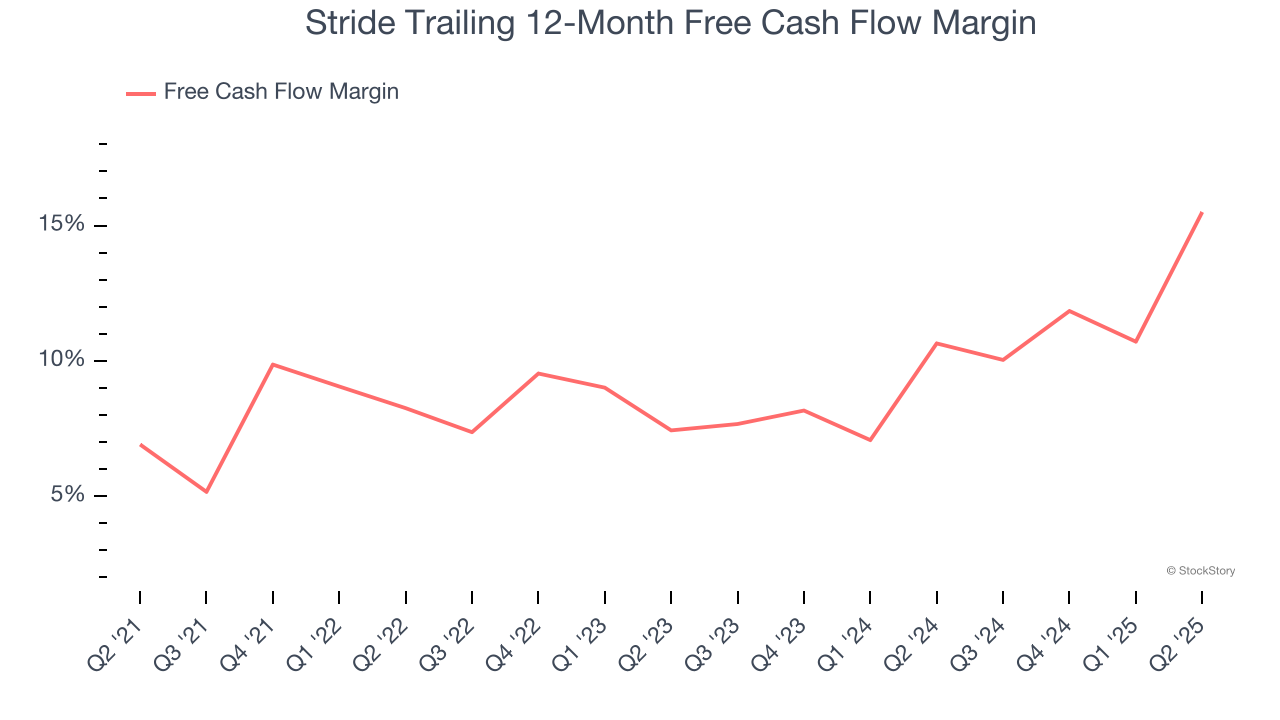
3. Increasing Free Cash Flow Margin Juices Financials
Free cash flow isn't a prominently featured metric in company financials and earnings releases, but we think it's telling because it accounts for all operating and capital expenses, making it tough to manipulate. Cash is king.
As you can see below, Stride’s margin expanded by 8.6 percentage points over the last five years. This is encouraging because it gives the company more optionality. Stride’s free cash flow margin for the trailing 12 months was 15.5%.
Final Judgment
These are just a few reasons why Stride ranks near the top of our list, but at $143 per share (or 18× forward P/E), is now the time to initiate a position? See for yourself in our in-depth research report, it’s free.
Stocks We Like Even More Than Stride
Trump’s April 2025 tariff bombshell triggered a massive market selloff, but stocks have since staged an impressive recovery, leaving those who panic sold on the sidelines.
Take advantage of the rebound by checking out our Top 5 Growth Stocks for this month. This is a curated list of our High Quality stocks that have generated a market-beating return of 183% over the last five years (as of March 31st 2025).
Stocks that made our list in 2020 include now familiar names such as Nvidia (+1,545% between March 2020 and March 2025) as well as under-the-radar businesses like the once-micro-cap company Tecnoglass (+1,754% five-year return). Find your next big winner with StockStory today.
StockStory is growing and hiring equity analyst and marketing roles. Are you a 0 to 1 builder passionate about the markets and AI? See the open roles here.