
Let’s dig into the relative performance of Papa John's (NASDAQ: PZZA) and its peers as we unravel the now-completed Q2 traditional fast food earnings season.
Traditional fast-food restaurants are renowned for their speed and convenience, boasting menus filled with familiar and budget-friendly items. Their reputations for on-the-go consumption make them favored destinations for individuals and families needing a quick meal. This class of restaurants, however, is fighting the perception that their meals are unhealthy and made with inferior ingredients, a battle that's especially relevant today given the consumers increasing focus on health and wellness.
The 14 traditional fast food stocks we track reported a mixed Q2. As a group, revenues were in line with analysts’ consensus estimates.
In light of this news, share prices of the companies have held steady as they are up 1.6% on average since the latest earnings results.
Papa John's (NASDAQ: PZZA)
Founded by the eclectic John “Papa John” Schnatter, Papa John’s (NASDAQ: PZZA) is a globally recognized pizza delivery and carryout chain known for “better ingredients” and “better pizza”.
Papa John's reported revenues of $529.2 million, up 4.2% year on year. This print exceeded analysts’ expectations by 2.7%. Overall, it was a very strong quarter for the company with an impressive beat of analysts’ same-store sales estimates and a beat of analysts’ EPS estimates.
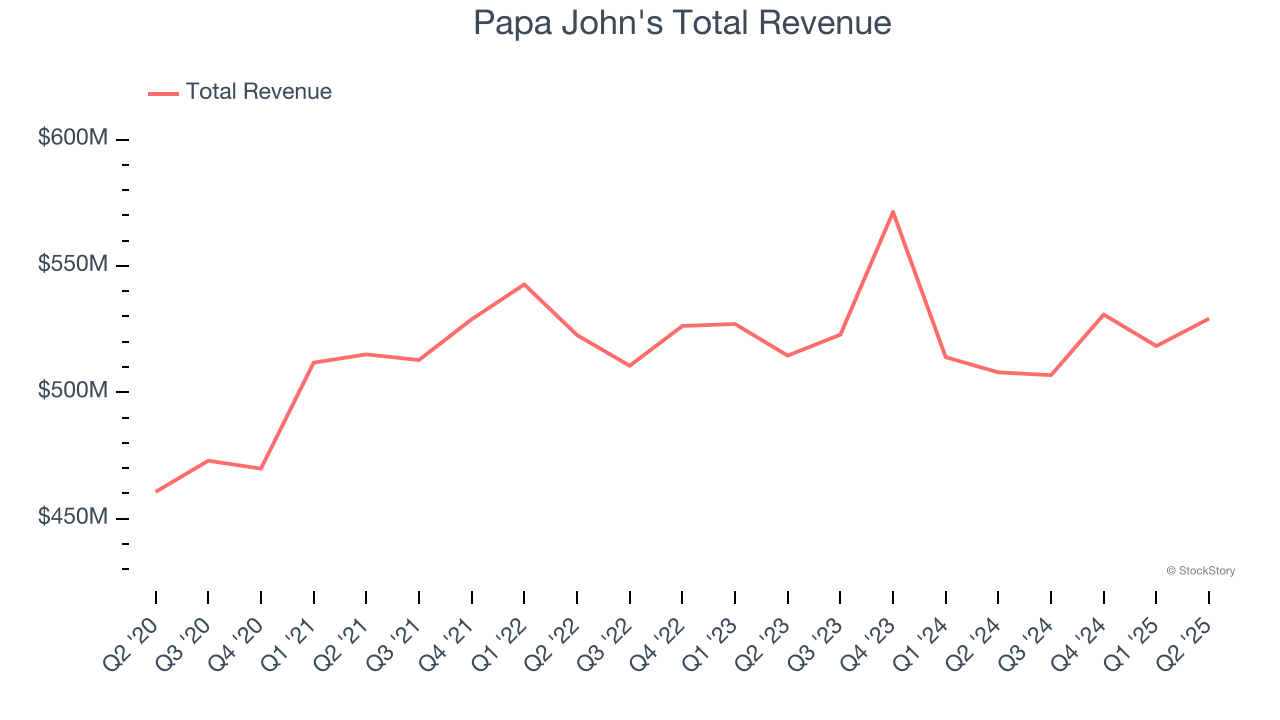
Interestingly, the stock is up 18.5% since reporting and currently trades at $48.02.
Is now the time to buy Papa John's? Access our full analysis of the earnings results here, it’s free.
Best Q2: Dutch Bros (NYSE: BROS)
Started in 1992 by two brothers as a single pushcart, Dutch Bros (NYSE: BROS) is a dynamic coffee chain that’s captured the hearts of coffee enthusiasts across the United States.
Dutch Bros reported revenues of $415.8 million, up 28% year on year, outperforming analysts’ expectations by 3.1%. The business had a stunning quarter with an impressive beat of analysts’ EBITDA and same-store sales estimates.
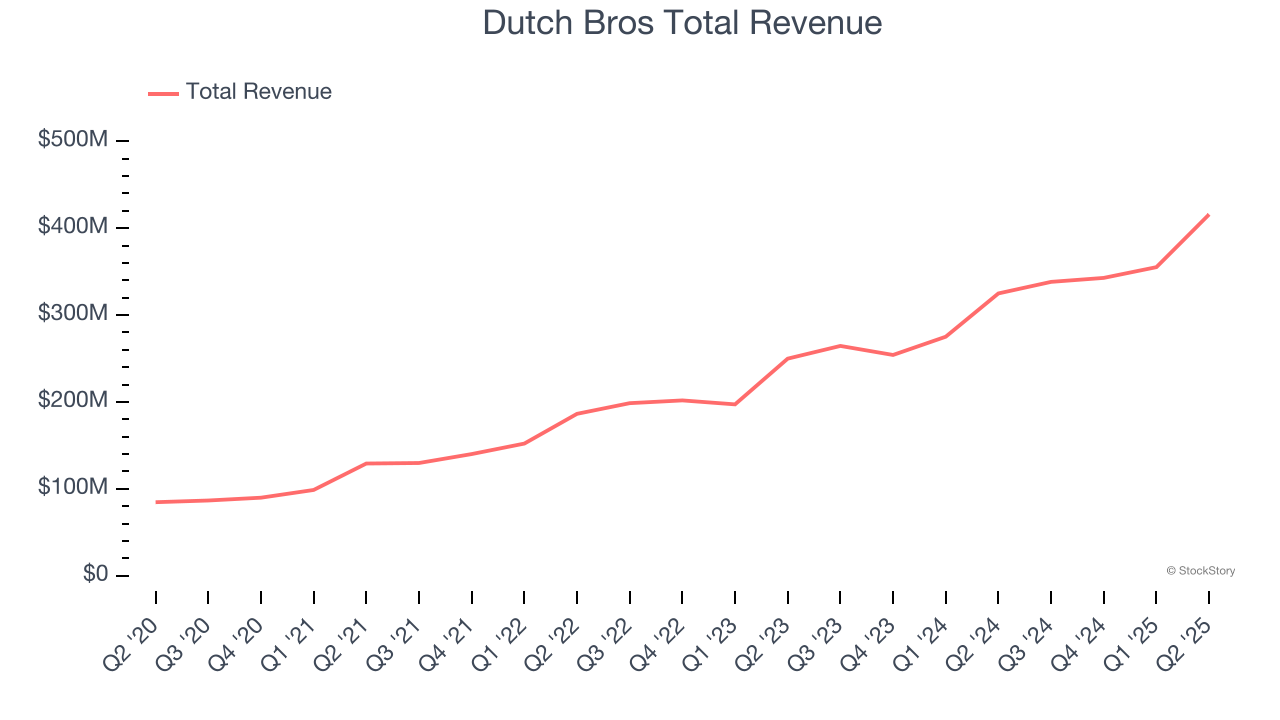
Dutch Bros scored the biggest analyst estimates beat and fastest revenue growth among its peers. The market seems happy with the results as the stock is up 24.4% since reporting. It currently trades at $71.90.
Is now the time to buy Dutch Bros? Access our full analysis of the earnings results here, it’s free.
Weakest Q2: Jack in the Box (NASDAQ: JACK)
Delighting customers since its inception in 1951, Jack in the Box (NASDAQ: JACK) is a distinctive fast-food chain known for its bold flavors, innovative menu items, and quirky marketing.
Jack in the Box reported revenues of $333 million, down 9.8% year on year, falling short of analysts’ expectations by 2.1%. It was a softer quarter as it posted a miss of analysts’ EBITDA and same-store sales estimates.
The stock is flat since the results and currently trades at $19.11.
Read our full analysis of Jack in the Box’s results here.
El Pollo Loco (NASDAQ: LOCO)
With a name that translates into ‘The Crazy Chicken’, El Pollo Loco (NASDAQ: LOCO) is a fast food chain known for its citrus-marinated, fire-grilled chicken recipe that hails from the coastal town of Sinaloa, Mexico.
El Pollo Loco reported revenues of $125.8 million, up 3% year on year. This result topped analysts’ expectations by 0.6%. Overall, it was a very strong quarter as it also put up a solid beat of analysts’ EBITDA estimates and a beat of analysts’ EPS estimates.
The stock is up 4.9% since reporting and currently trades at $10.84.
Read our full, actionable report on El Pollo Loco here, it’s free.
Domino's (NASDAQ: DPZ)
Founded by two brothers in Michigan, Domino’s (NYSE: DPZ) is a globally recognized pizza chain known for its creative marketing and fast delivery.
Domino's reported revenues of $1.15 billion, up 4.3% year on year. This print was in line with analysts’ expectations. It was a strong quarter as it also logged an impressive beat of analysts’ same-store sales estimates and a solid beat of analysts’ EBITDA estimates.
The stock is down 1.8% since reporting and currently trades at $458.35.
Read our full, actionable report on Domino's here, it’s free.
Market Update
In response to the Fed’s rate hikes in 2022 and 2023, inflation has been gradually trending down from its post-pandemic peak, trending closer to the Fed’s 2% target. Despite higher borrowing costs, the economy has avoided flashing recessionary signals. This is the much-desired soft landing that many investors hoped for. The recent rate cuts (0.5% in September and 0.25% in November 2024) have bolstered the stock market, making 2024 a strong year for equities. Donald Trump’s presidential win in November sparked additional market gains, sending indices to record highs in the days following his victory. However, debates continue over possible tariffs and corporate tax adjustments, raising questions about economic stability in 2025.
Want to invest in winners with rock-solid fundamentals? Check out our Strong Momentum Stocks and add them to your watchlist. These companies are poised for growth regardless of the political or macroeconomic climate.
StockStory is growing and hiring equity analyst and marketing roles. Are you a 0 to 1 builder passionate about the markets and AI? See the open roles here.


