
Topgolf Callaway has had an impressive run over the past six months as its shares have beaten the S&P 500 by 16.2%. The stock now trades at $9.10, marking a 31.7% gain. This was partly due to its solid quarterly results, and the performance may have investors wondering how to approach the situation.
Is there a buying opportunity in Topgolf Callaway, or does it present a risk to your portfolio? Get the full stock story straight from our expert analysts, it’s free.
Why Do We Think Topgolf Callaway Will Underperform?
We’re glad investors have benefited from the price increase, but we're sitting this one out for now. Here are three reasons you should be careful with MODG and a stock we'd rather own.
1. Declining Constant Currency Revenue, Demand Takes a Hit
Investors interested in Leisure Facilities companies should track constant currency revenue in addition to reported revenue. This metric excludes currency movements, which are outside of Topgolf Callaway’s control and are not indicative of underlying demand.
Over the last two years, Topgolf Callaway’s constant currency revenue averaged 1.9% year-on-year declines. This performance was underwhelming and implies there may be increasing competition or market saturation. It also suggests Topgolf Callaway might have to lower prices or invest in product improvements to accelerate growth, factors that can hinder near-term profitability.
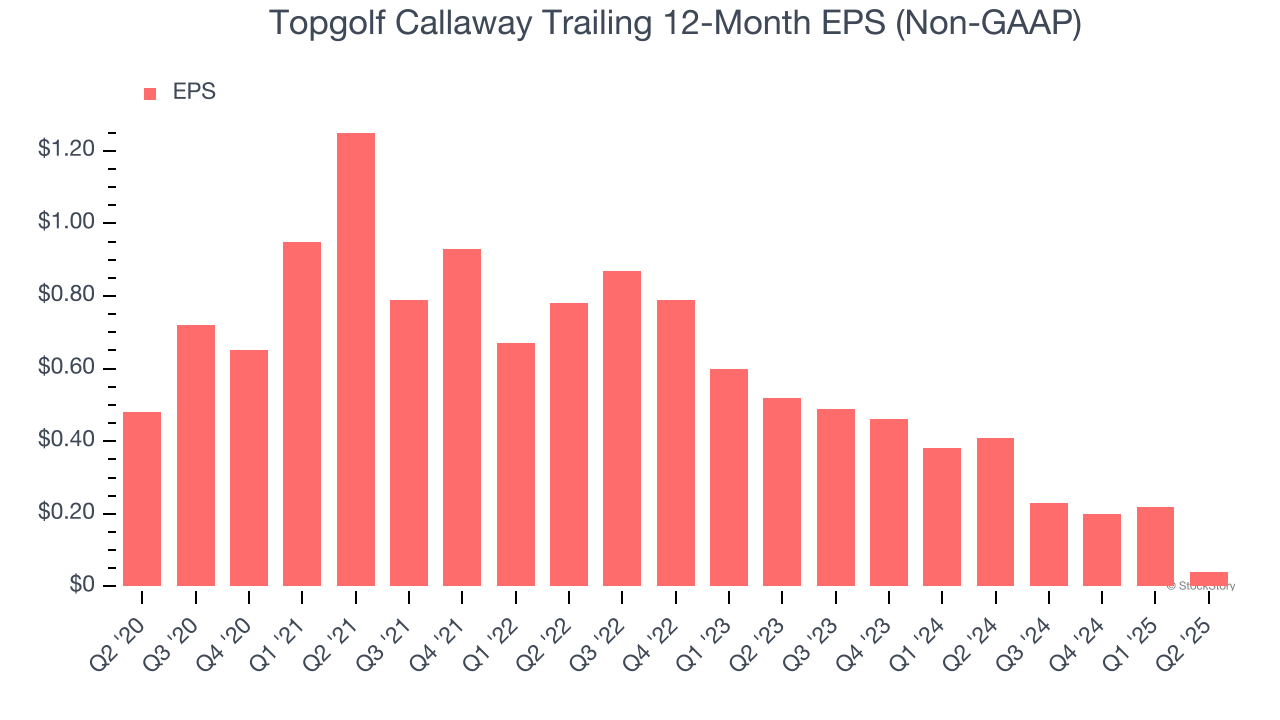
2. EPS Trending Down
We track the long-term change in earnings per share (EPS) because it highlights whether a company’s growth is profitable.
Sadly for Topgolf Callaway, its EPS declined by 39.2% annually over the last five years while its revenue grew by 22.9%. This tells us the company became less profitable on a per-share basis as it expanded.
3. New Investments Fail to Bear Fruit as ROIC Declines
ROIC, or return on invested capital, is a metric showing how much operating profit a company generates relative to the money it has raised (debt and equity).
We like to invest in businesses with high returns, but the trend in a company’s ROIC is what often surprises the market and moves the stock price. Unfortunately, Topgolf Callaway’s ROIC has decreased significantly over the last few years. Paired with its already low returns, these declines suggest its profitable growth opportunities are few and far between.
Final Judgment
Topgolf Callaway doesn’t pass our quality test. With its shares beating the market recently, the stock trades at 3.7× forward EV-to-EBITDA (or $9.10 per share). While this valuation is optically cheap, the potential downside is huge given its shaky fundamentals. There are better stocks to buy right now. We’d recommend looking at the Amazon and PayPal of Latin America.
High-Quality Stocks for All Market Conditions
Trump’s April 2025 tariff bombshell triggered a massive market selloff, but stocks have since staged an impressive recovery, leaving those who panic sold on the sidelines.
Take advantage of the rebound by checking out our Top 5 Strong Momentum Stocks for this week. This is a curated list of our High Quality stocks that have generated a market-beating return of 183% over the last five years (as of March 31st 2025).
Stocks that made our list in 2020 include now familiar names such as Nvidia (+1,545% between March 2020 and March 2025) as well as under-the-radar businesses like the once-micro-cap company Tecnoglass (+1,754% five-year return). Find your next big winner with StockStory today.
StockStory is growing and hiring equity analyst and marketing roles. Are you a 0 to 1 builder passionate about the markets and AI? See the open roles here.


