What a fantastic six months it’s been for MasTec. Shares of the company have skyrocketed 56.6%, hitting $206.25. This was partly due to its solid quarterly results, and the performance may have investors wondering how to approach the situation.
Is now the time to buy MasTec, or should you be careful about including it in your portfolio? Dive into our full research report to see our analyst team’s opinion, it’s free.
Why Is MasTec Not Exciting?
We’re glad investors have benefited from the price increase, but we're cautious about MasTec. Here are three reasons we avoid MTZ and a stock we'd rather own.
1. Low Gross Margin Reveals Weak Structural Profitability
For industrials businesses, cost of sales is usually comprised of the direct labor, raw materials, and supplies needed to offer a product or service. These costs can be impacted by inflation and supply chain dynamics in the short term and a company’s purchasing power and scale over the long term.
MasTec has bad unit economics for an industrials business, signaling it operates in a competitive market. As you can see below, it averaged a 13.1% gross margin over the last five years. That means MasTec paid its suppliers a lot of money ($86.93 for every $100 in revenue) to run its business. 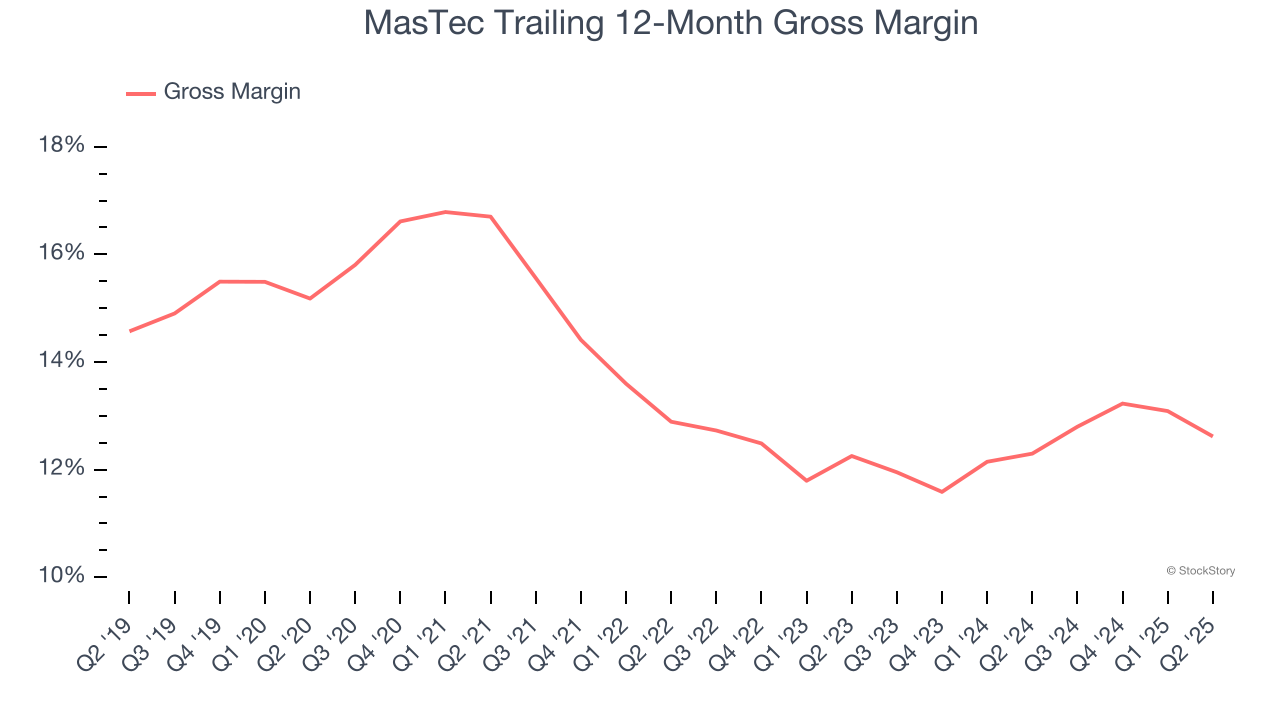
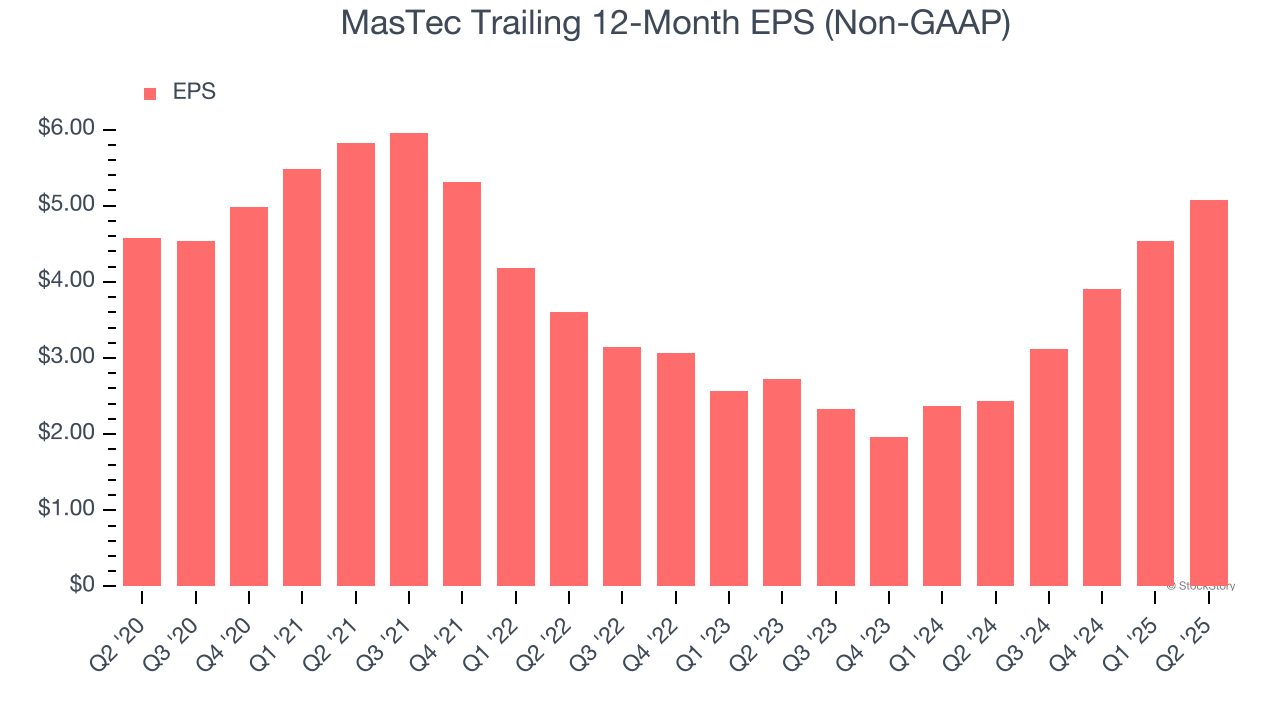
2. EPS Barely Growing
Analyzing the long-term change in earnings per share (EPS) shows whether a company's incremental sales were profitable – for example, revenue could be inflated through excessive spending on advertising and promotions.
MasTec’s EPS grew at a weak 2.1% compounded annual growth rate over the last five years, lower than its 14.2% annualized revenue growth. This tells us the company became less profitable on a per-share basis as it expanded.
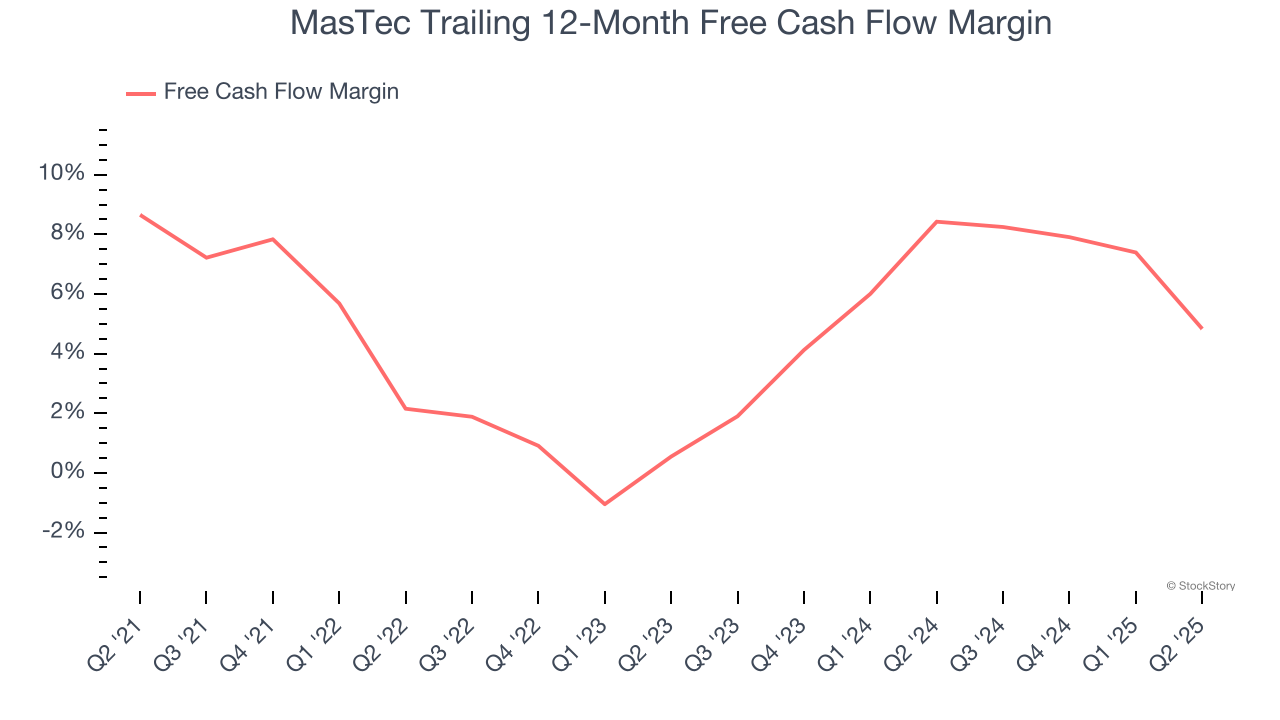
3. Free Cash Flow Margin Dropping
Free cash flow isn't a prominently featured metric in company financials and earnings releases, but we think it's telling because it accounts for all operating and capital expenses, making it tough to manipulate. Cash is king.
As you can see below, MasTec’s margin dropped by 3.8 percentage points over the last five years. This along with its unexciting margin put the company in a tough spot, and shareholders are likely hoping it can reverse course. If the trend continues, it could signal it’s in the middle of an investment cycle. MasTec’s free cash flow margin for the trailing 12 months was 4.8%.
Final Judgment
MasTec isn’t a terrible business, but it doesn’t pass our bar. Following the recent rally, the stock trades at 31.6× forward P/E (or $206.25 per share). Investors with a higher risk tolerance might like the company, but we think the potential downside is too great. We're fairly confident there are better stocks to buy right now. We’d suggest looking at one of our top software and edge computing picks.
Stocks We Would Buy Instead of MasTec
Trump’s April 2025 tariff bombshell triggered a massive market selloff, but stocks have since staged an impressive recovery, leaving those who panic sold on the sidelines.
Take advantage of the rebound by checking out our Top 5 Strong Momentum Stocks for this week. This is a curated list of our High Quality stocks that have generated a market-beating return of 183% over the last five years (as of March 31st 2025).
Stocks that made our list in 2020 include now familiar names such as Nvidia (+1,545% between March 2020 and March 2025) as well as under-the-radar businesses like the once-small-cap company Comfort Systems (+782% five-year return). Find your next big winner with StockStory today.
StockStory is growing and hiring equity analyst and marketing roles. Are you a 0 to 1 builder passionate about the markets and AI? See the open roles here.