EV charging solutions provider ChargePoint Holdings (NYSE: CHPT) beat Wall Street’s revenue expectations in Q2 CY2025, but sales fell by 9.2% year on year to $98.59 million. On the other hand, next quarter’s revenue guidance of $95 million was less impressive, coming in 11.5% below analysts’ estimates. Its GAAP loss of $2.85 per share was 27.3% below analysts’ consensus estimates.
Is now the time to buy ChargePoint? Find out by accessing our full research report, it’s free.
ChargePoint (CHPT) Q2 CY2025 Highlights:
- Revenue: $98.59 million vs analyst estimates of $95.44 million (9.2% year-on-year decline, 3.3% beat)
- EPS (GAAP): -$2.85 vs analyst expectations of -$2.24 (27.3% miss)
- Adjusted EBITDA: -$22.07 million vs analyst estimates of -$17.84 million (-22.4% margin, 23.7% miss)
- Revenue Guidance for Q3 CY2025 is $95 million at the midpoint, below analyst estimates of $107.3 million
- Operating Margin: -59.8%, down from -57.8% in the same quarter last year
- Free Cash Flow was -$7.45 million compared to -$55 million in the same quarter last year
- Market Capitalization: $247.4 million
Company Overview
The most prominent EV charging company during the COVID bull market, ChargePoint (NYSE: CHPT) is a provider of electric vehicle charging technology solutions in North America and Europe.
Revenue Growth
A company’s long-term sales performance is one signal of its overall quality. Any business can put up a good quarter or two, but the best consistently grow over the long haul. Luckily, ChargePoint’s sales grew at an incredible 21.5% compounded annual growth rate over the last five years. Its growth beat the average industrials company and shows its offerings resonate with customers.
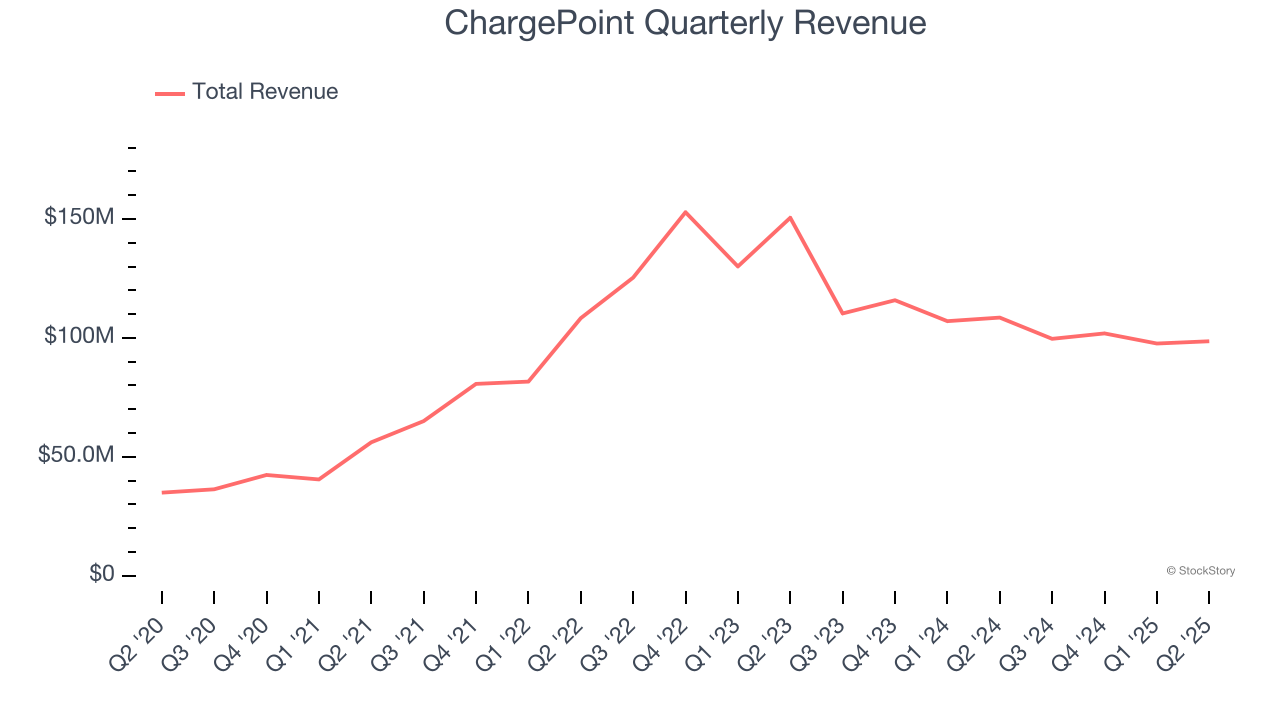
We at StockStory place the most emphasis on long-term growth, but within industrials, a half-decade historical view may miss cycles, industry trends, or a company capitalizing on catalysts such as a new contract win or a successful product line. ChargePoint’s recent performance marks a sharp pivot from its five-year trend as its revenue has shown annualized declines of 15.6% over the last two years. ChargePoint isn’t alone in its struggles as the Renewable Energy industry experienced a cyclical downturn, with many similar businesses observing lower sales at this time. 
ChargePoint also breaks out the revenue for its most important segments, Networked Charging Systems and Subscriptions, which are 51.1% and 40.5% of revenue. Over the last two years, ChargePoint’s Networked Charging Systems revenue (hardware) averaged 30.1% year-on-year declines. On the other hand, its Subscriptions revenue (software) averaged 22% growth. 
This quarter, ChargePoint’s revenue fell by 9.2% year on year to $98.59 million but beat Wall Street’s estimates by 3.3%. Company management is currently guiding for a 4.6% year-on-year decline in sales next quarter.
Looking further ahead, sell-side analysts expect revenue to grow 14.6% over the next 12 months, an improvement versus the last two years. This projection is commendable and implies its newer products and services will catalyze better top-line performance.
Unless you’ve been living under a rock, it should be obvious by now that generative AI is going to have a huge impact on how large corporations do business. While Nvidia and AMD are trading close to all-time highs, we prefer a lesser-known (but still profitable) stock benefiting from the rise of AI. Click here to access our free report one of our favorites growth stories.
Operating Margin
ChargePoint’s high expenses have contributed to an average operating margin of negative 78.1% over the last five years. Unprofitable industrials companies require extra attention because they could get caught swimming naked when the tide goes out. It’s hard to trust that the business can endure a full cycle.
On the plus side, ChargePoint’s operating margin rose by 48.3 percentage points over the last five years, as its sales growth gave it operating leverage. Still, it will take much more for the company to reach long-term profitability.
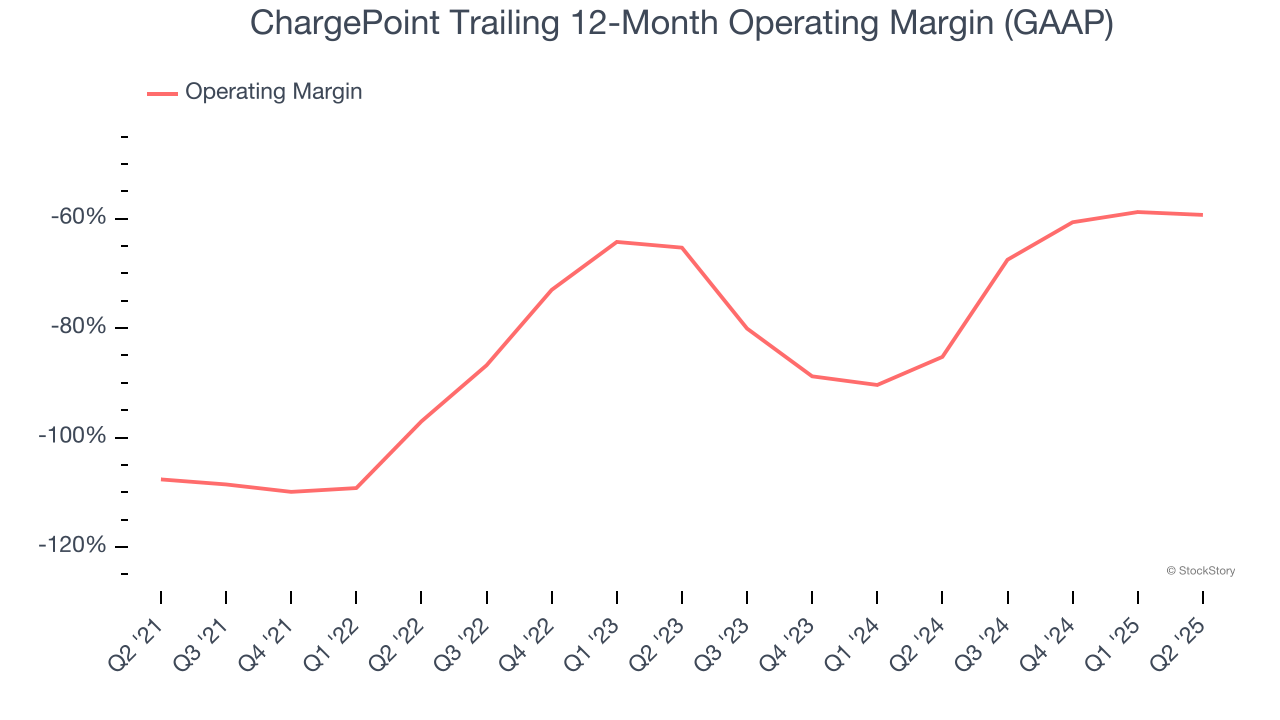
In Q2, ChargePoint generated a negative 59.8% operating margin.
Earnings Per Share
We track the long-term change in earnings per share (EPS) for the same reason as long-term revenue growth. Compared to revenue, however, EPS highlights whether a company’s growth is profitable.
Although ChargePoint’s full-year earnings are still negative, it reduced its losses and improved its EPS by 48.8% annually over the last five years. The next few quarters will be critical for assessing its long-term profitability. We hope to see an inflection point soon.
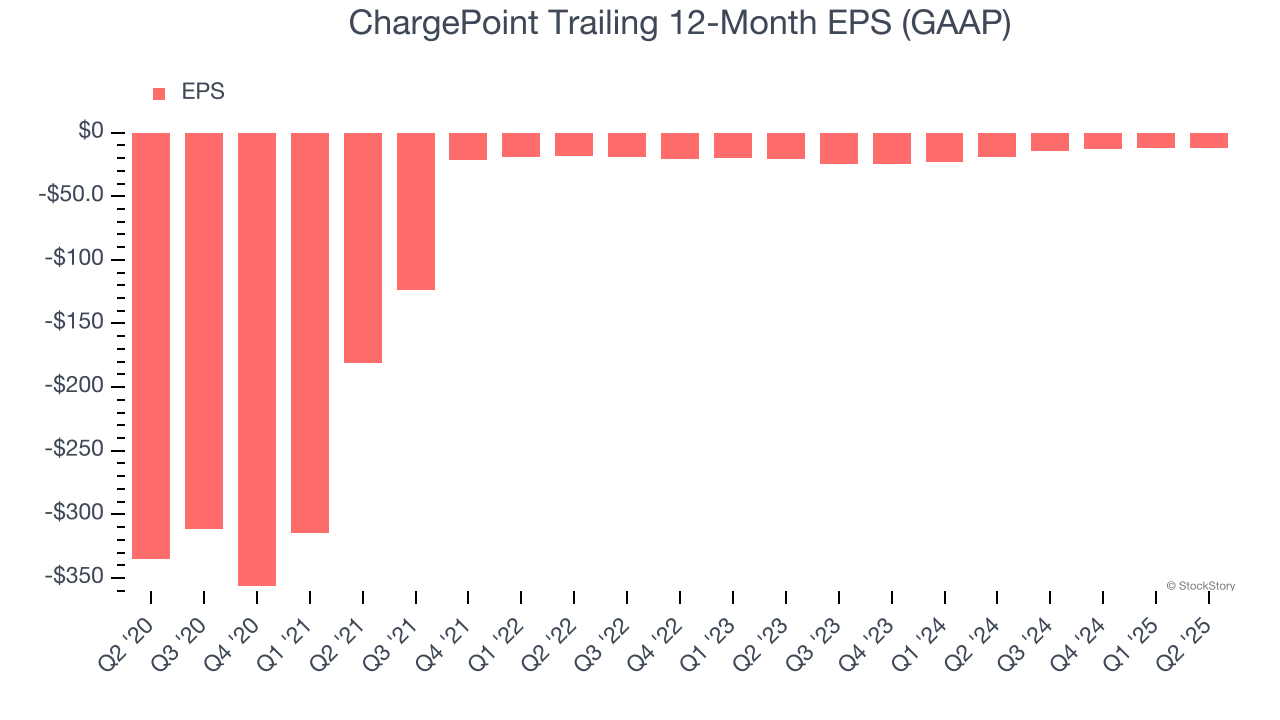
Like with revenue, we analyze EPS over a more recent period because it can provide insight into an emerging theme or development for the business.
For ChargePoint, its two-year annual EPS growth of 25.3% was lower than its five-year trend. We still think its growth was good and hope it can accelerate in the future.
In Q2, ChargePoint reported EPS of negative $2.85, up from negative $3.22 in the same quarter last year. Despite growing year on year, this print missed analysts’ estimates. Over the next 12 months, Wall Street expects ChargePoint to improve its earnings losses. Analysts forecast its full-year EPS of negative $11.79 will advance to negative $7.76.
Key Takeaways from ChargePoint’s Q2 Results
We were also glad its revenue outperformed Wall Street’s estimates. On the other hand, its revenue guidance for next quarter missed and its EBITDA fell short of Wall Street’s estimates. Overall, this was a weaker quarter. The stock traded down 1.7% to $10.69 immediately following the results.
ChargePoint’s earnings report left more to be desired. Let’s look forward to see if this quarter has created an opportunity to buy the stock. What happened in the latest quarter matters, but not as much as longer-term business quality and valuation, when deciding whether to invest in this stock. We cover that in our actionable full research report which you can read here, it’s free.