Since September 2020, the S&P 500 has delivered a total return of 98.1%. But one standout stock has nearly doubled the market - over the past five years, Armstrong World has surged 182% to $193.73 per share. Its momentum hasn’t stopped as it’s also gained 37.5% in the last six months thanks to its solid quarterly results, beating the S&P by 18.9%.
Is it too late to buy AWI? Find out in our full research report, it’s free.
Why Are We Positive On Armstrong World?
Started as a two-man shop dating back to the 1860s, Armstrong (NYSE: AWI) provides ceiling and wall products to commercial and residential spaces.
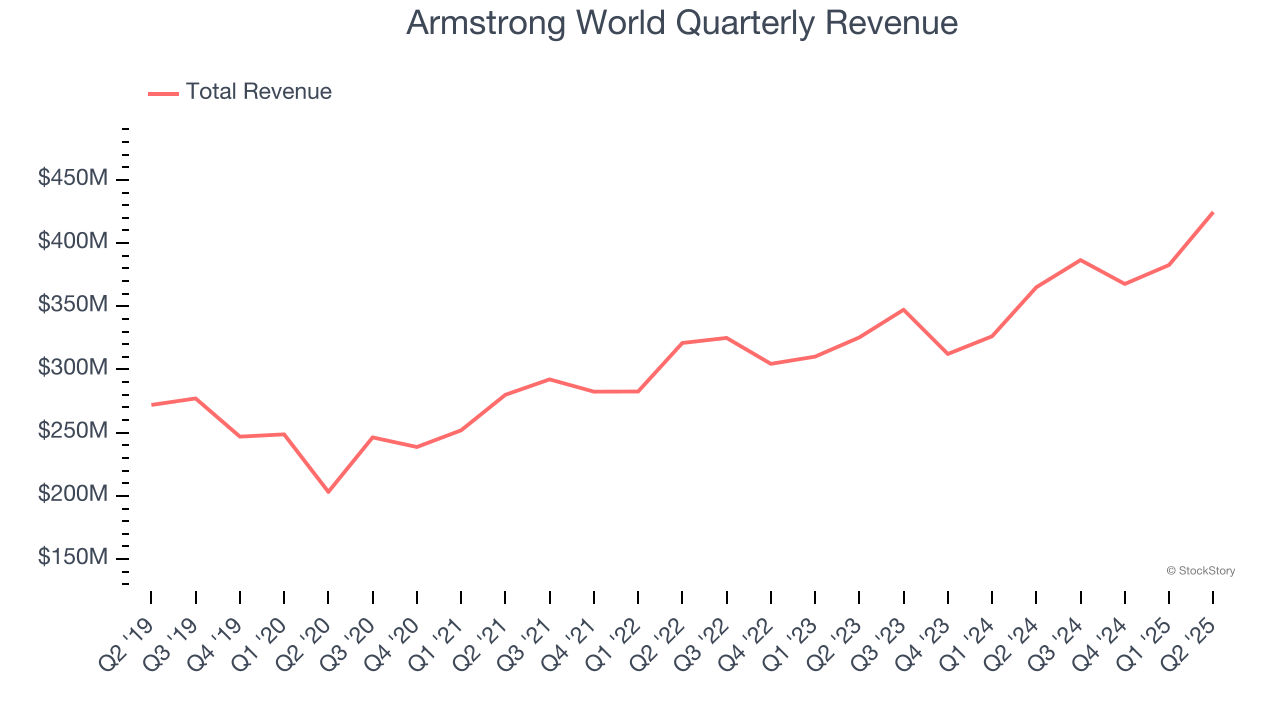
1. Long-Term Revenue Growth Shows Strong Momentum
Examining a company’s long-term performance can provide clues about its quality. Any business can put up a good quarter or two, but many enduring ones grow for years. Thankfully, Armstrong World’s 9.9% annualized revenue growth over the last five years was solid. Its growth beat the average industrials company and shows its offerings resonate with customers.
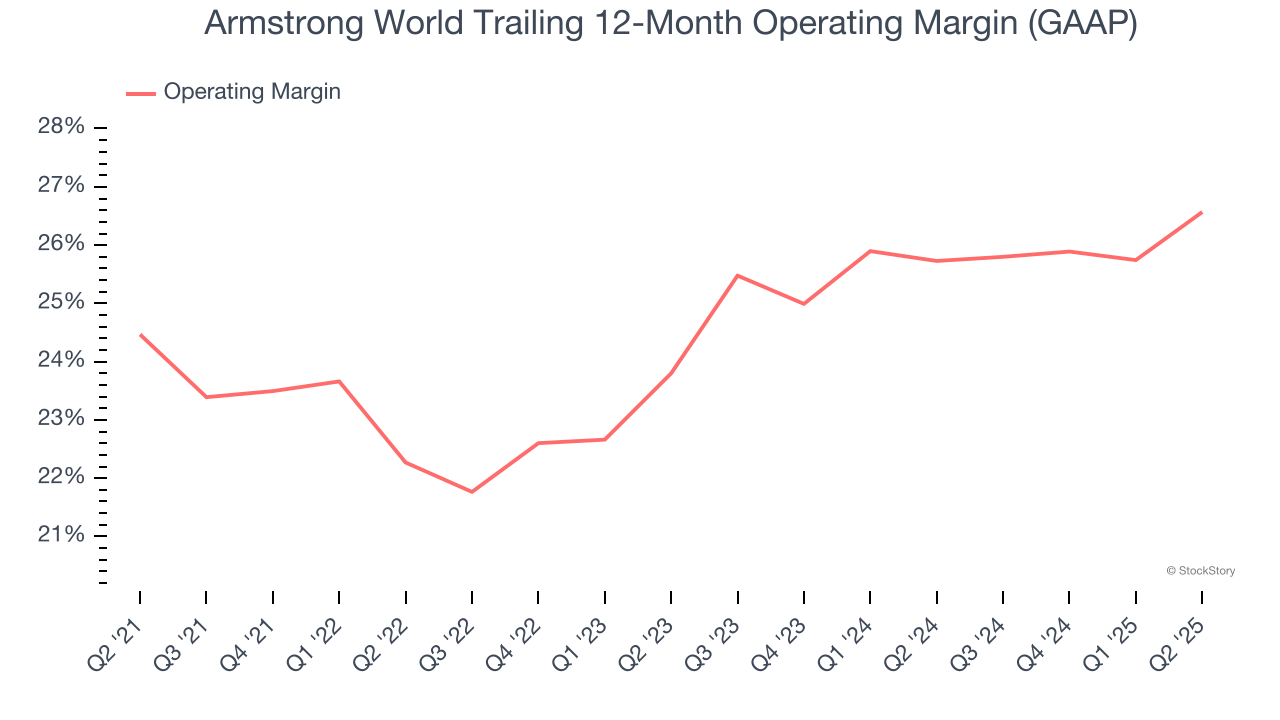
2. Operating Margin Reveals a Well-Run Organization
Operating margin is an important measure of profitability as it shows the portion of revenue left after accounting for all core expenses – everything from the cost of goods sold to advertising and wages. It’s also useful for comparing profitability across companies with different levels of debt and tax rates because it excludes interest and taxes.
Armstrong World has been a well-oiled machine over the last five years. It demonstrated elite profitability for an industrials business, boasting an average operating margin of 24.7%. This result isn’t surprising as its high gross margin gives it a favorable starting point.
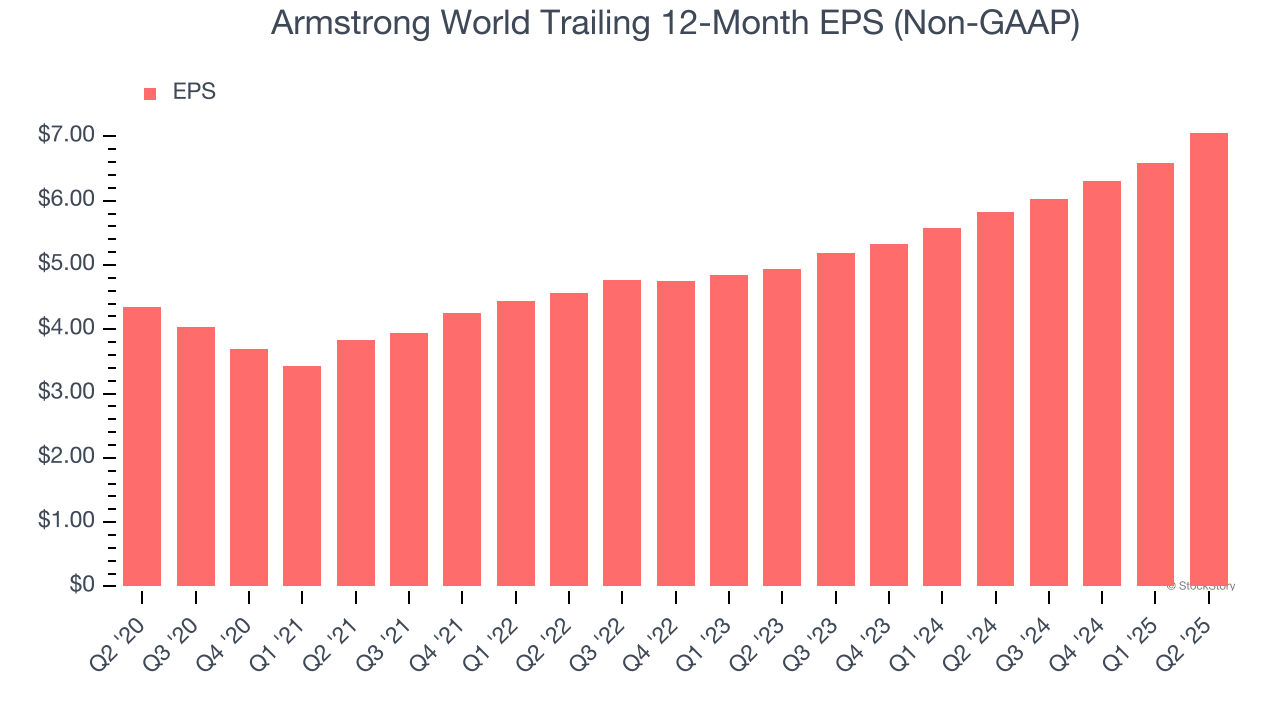
3. EPS Increasing Steadily
We track the long-term change in earnings per share (EPS) because it highlights whether a company’s growth is profitable.
Armstrong World’s solid 10.2% annual EPS growth over the last five years aligns with its revenue performance. This tells us its incremental sales were profitable.
Final Judgment
These are just a few reasons why Armstrong World ranks highly on our list, and with its shares topping the market in recent months, the stock trades at 26.1× forward P/E (or $193.73 per share). Is now a good time to initiate a position? See for yourself in our in-depth research report, it’s free.
Stocks We Like Even More Than Armstrong World
Donald Trump’s April 2025 "Liberation Day" tariffs sent markets into a tailspin, but stocks have since rebounded strongly, proving that knee-jerk reactions often create the best buying opportunities.
The smart money is already positioning for the next leg up. Don’t miss out on the recovery - check out our Top 5 Growth Stocks for this month. This is a curated list of our High Quality stocks that have generated a market-beating return of 183% over the last five years (as of March 31st 2025).
Stocks that made our list in 2020 include now familiar names such as Nvidia (+1,545% between March 2020 and March 2025) as well as under-the-radar businesses like the once-micro-cap company Kadant (+351% five-year return). Find your next big winner with StockStory today.
StockStory is growing and hiring equity analyst and marketing roles. Are you a 0 to 1 builder passionate about the markets and AI? See the open roles here.


