Potato products company Lamb Weston (NYSE: LW) reported Q3 CY2025 results exceeding the market’s revenue expectations, but sales were flat year on year at $1.66 billion. On the other hand, the company’s full-year revenue guidance of $6.45 billion at the midpoint came in 0.5% below analysts’ estimates. Its non-GAAP profit of $0.74 per share was 38.7% above analysts’ consensus estimates.
Is now the time to buy Lamb Weston? Find out by accessing our full research report, it’s free.
Lamb Weston (LW) Q3 CY2025 Highlights:
- Revenue: $1.66 billion vs analyst estimates of $1.62 billion (flat year on year, 2.6% beat)
- Adjusted EPS: $0.74 vs analyst estimates of $0.53 (38.7% beat)
- Adjusted EBITDA: $302.2 million vs analyst estimates of $254.1 million (18.2% margin, 18.9% beat)
- The company reconfirmed its revenue guidance for the full year of $6.45 billion at the midpoint
- EBITDA guidance for the full year is $1.1 billion at the midpoint, below analyst estimates of $1.14 billion
- Operating Margin: 9.4%, down from 12.8% in the same quarter last year
- Free Cash Flow Margin: 16.5%, up from 0.3% in the same quarter last year
- Organic Revenue fell 1% year on year vs analyst estimates of 2.4% declines (140.2 basis point beat)
- Sales Volumes rose 6% year on year (-3% in the same quarter last year)
- Market Capitalization: $7.76 billion
“The Lamb Weston team delivered a strong start to the fiscal year with solid volume growth and positive customer momentum, underscoring the strength of our value proposition and our operating model,” said Mike Smith, Lamb Weston president and CEO.
Company Overview
Best known for its Grown in Idaho brand, Lamb Weston (NYSE: LW) produces and distributes potato products such as frozen french fries and mashed potatoes.
Revenue Growth
Examining a company’s long-term performance can provide clues about its quality. Even a bad business can shine for one or two quarters, but a top-tier one grows for years.
With $6.46 billion in revenue over the past 12 months, Lamb Weston is one of the larger consumer staples companies and benefits from a well-known brand that influences purchasing decisions.
As you can see below, Lamb Weston grew its sales at a solid 15% compounded annual growth rate over the last three years as consumers bought more of its products.
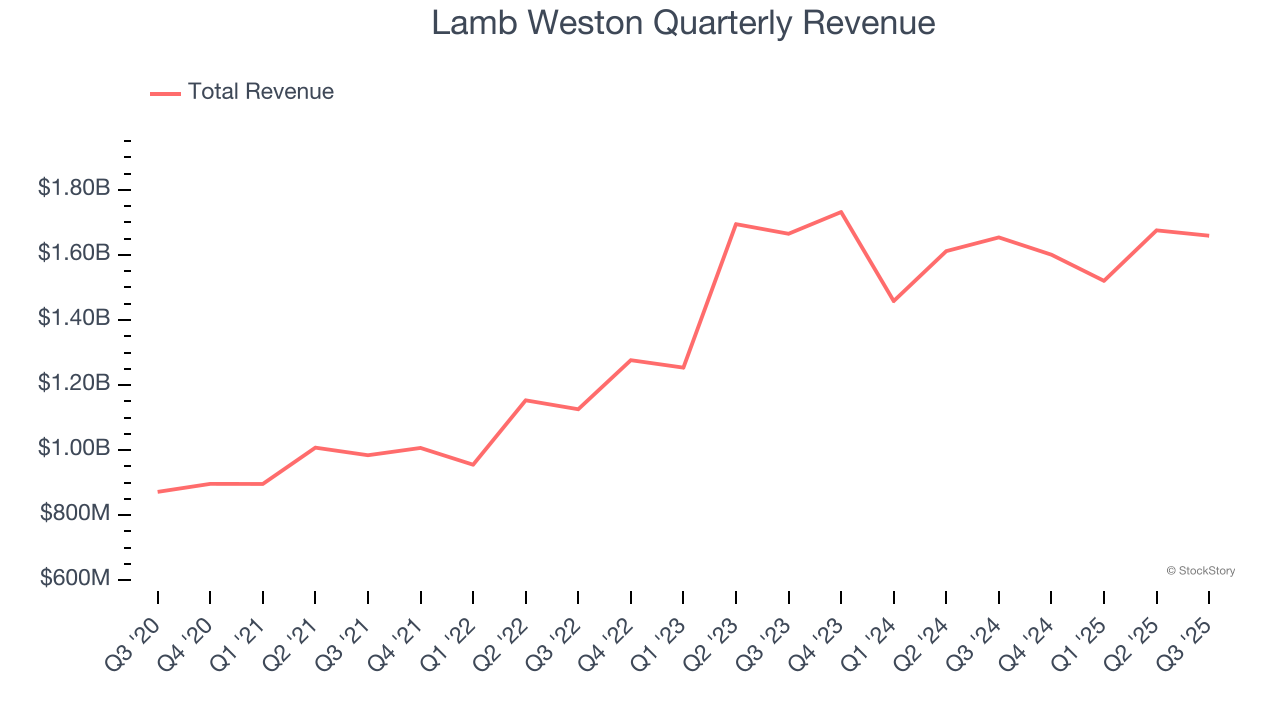
This quarter, Lamb Weston’s $1.66 billion of revenue was flat year on year but beat Wall Street’s estimates by 2.6%.
Looking ahead, sell-side analysts expect revenue to remain flat over the next 12 months, a deceleration versus the last three years. This projection is underwhelming and suggests its products will face some demand challenges.
Unless you’ve been living under a rock, it should be obvious by now that generative AI is going to have a huge impact on how large corporations do business. While Nvidia and AMD are trading close to all-time highs, we prefer a lesser-known (but still profitable) stock benefiting from the rise of AI. Click here to access our free report one of our favorites growth stories.
Volume Growth
Revenue growth can be broken down into changes in price and volume (the number of units sold). While both are important, volume is the lifeblood of a successful staples business as there’s a ceiling to what consumers will pay for everyday goods; they can always trade down to non-branded products if the branded versions are too expensive.
To analyze whether Lamb Weston generated its growth from changes in price or volume, we can compare its volume growth to its organic revenue growth, which excludes non-fundamental impacts on company financials like mergers and currency fluctuations.
Over the last two years, Lamb Weston’s average quarterly volume growth was a robust 5.3%. In the context of its 5.6% average organic revenue growth, we can see that most of the company’s gains have come from more customers purchasing its products.
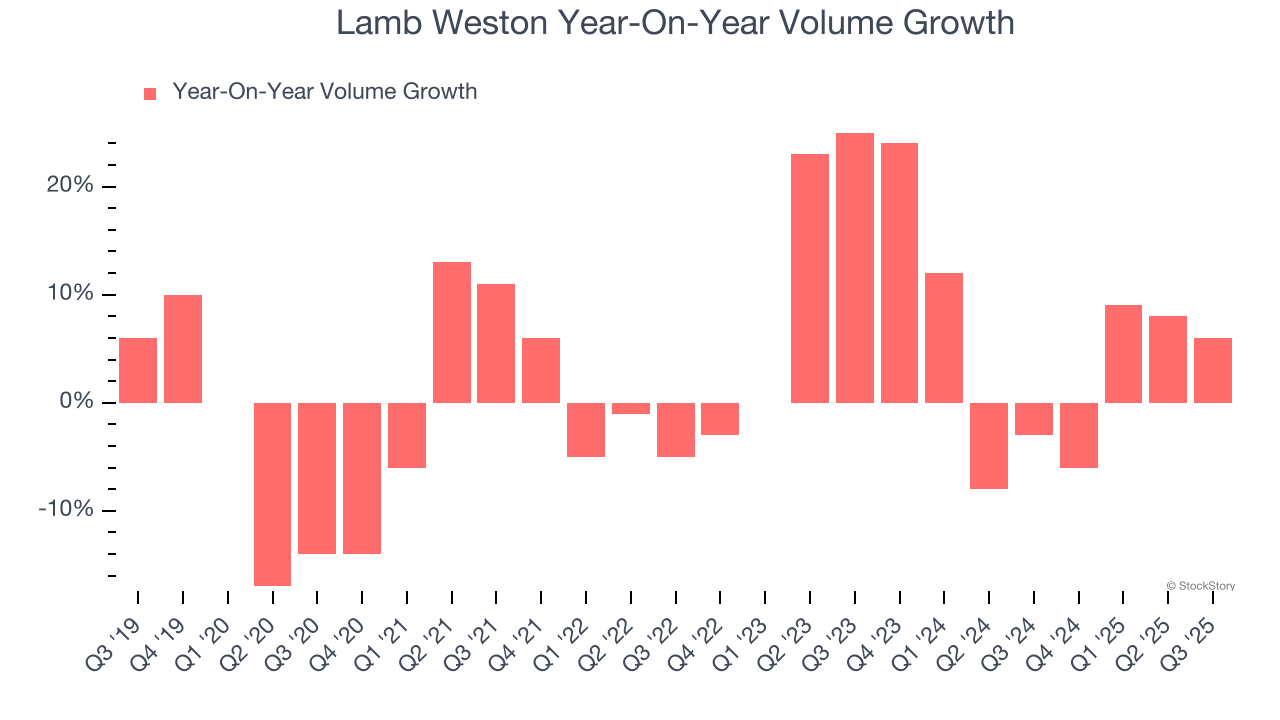
In Lamb Weston’s Q3 2026, sales volumes jumped 6% year on year. This result was an acceleration from its historical levels, certainly a positive signal.
Key Takeaways from Lamb Weston’s Q3 Results
We were impressed by how significantly Lamb Weston blew past analysts’ EBITDA expectations this quarter. We were also glad its gross margin outperformed Wall Street’s estimates. On the other hand, its full-year EBITDA guidance fell slightly short of Wall Street’s estimates. Overall, we think this was still a decent quarter with some key metrics above expectations. The stock traded up 8.3% to $60.32 immediately following the results.
Lamb Weston may have had a good quarter, but does that mean you should invest right now? We think that the latest quarter is only one piece of the longer-term business quality puzzle. Quality, when combined with valuation, can help determine if the stock is a buy. We cover that in our actionable full research report which you can read here, it’s free.