Recreational products manufacturer American Outdoor Brands (NASDAQ: AOUT) missed Wall Street’s revenue expectations in Q2 CY2025, with sales falling 28.7% year on year to $29.7 million. Its non-GAAP loss of $0.26 per share was 4% below analysts’ consensus estimates.
Is now the time to buy American Outdoor Brands? Find out by accessing our full research report, it’s free.
American Outdoor Brands (AOUT) Q2 CY2025 Highlights:
- Revenue: $29.7 million vs analyst estimates of $35.77 million (28.7% year-on-year decline, 17% miss)
- Adjusted EPS: -$0.26 vs analyst expectations of -$0.25 (4% miss)
- Adjusted EBITDA: -$3.12 million vs analyst estimates of -$1.64 million (-10.5% margin, 90.5% miss)
- Operating Margin: -23%, down from -6.2% in the same quarter last year
- Free Cash Flow was -$1.99 million compared to -$5.20 million in the same quarter last year
- Market Capitalization: $130.6 million
Company Overview
Spun off from Smith and Wesson in 2020, American Outdoor Brands (NASDAQ: AOUT) is an outdoor and recreational products company that offers outdoor and shooting sports products but does not sell firearms themselves.
Revenue Growth
A company’s long-term sales performance can indicate its overall quality. Any business can put up a good quarter or two, but many enduring ones grow for years. Over the last five years, American Outdoor Brands grew its sales at a weak 2.6% compounded annual growth rate. This was below our standards and is a poor baseline for our analysis.
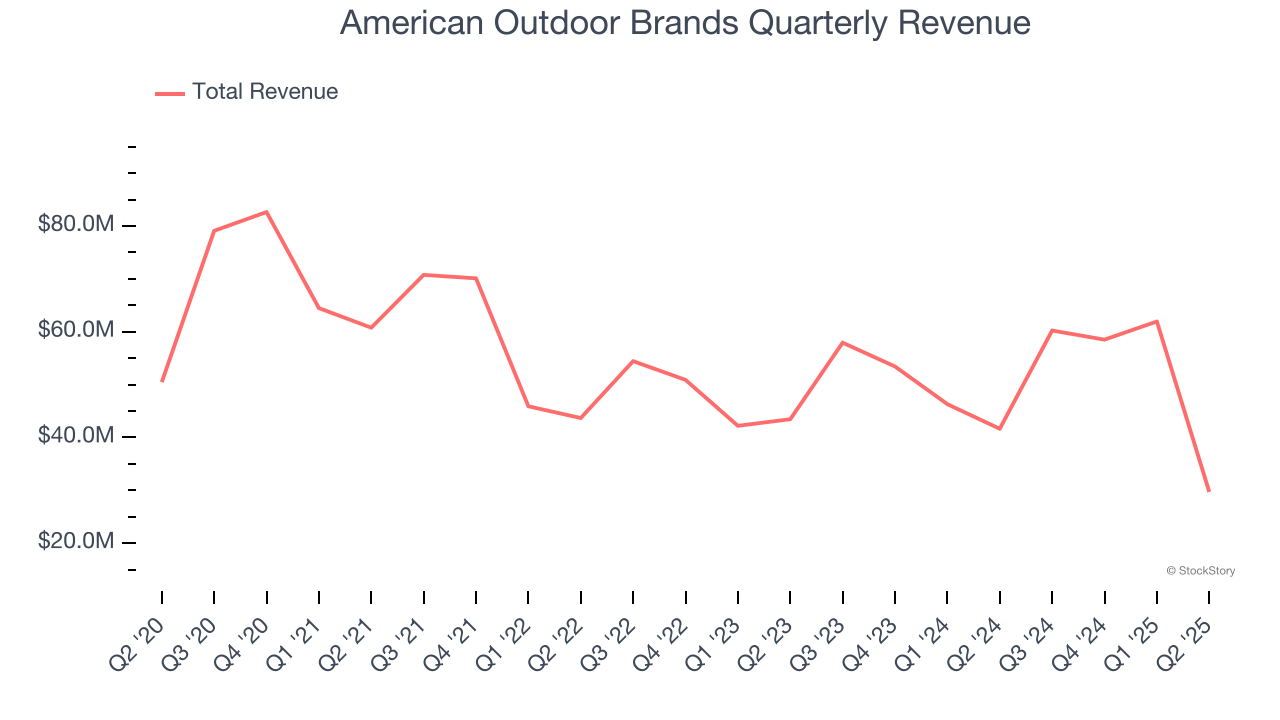
Long-term growth is the most important, but within consumer discretionary, product cycles are short and revenue can be hit-driven due to rapidly changing trends and consumer preferences. American Outdoor Brands’s annualized revenue growth of 5% over the last two years is above its five-year trend, but we were still disappointed by the results. 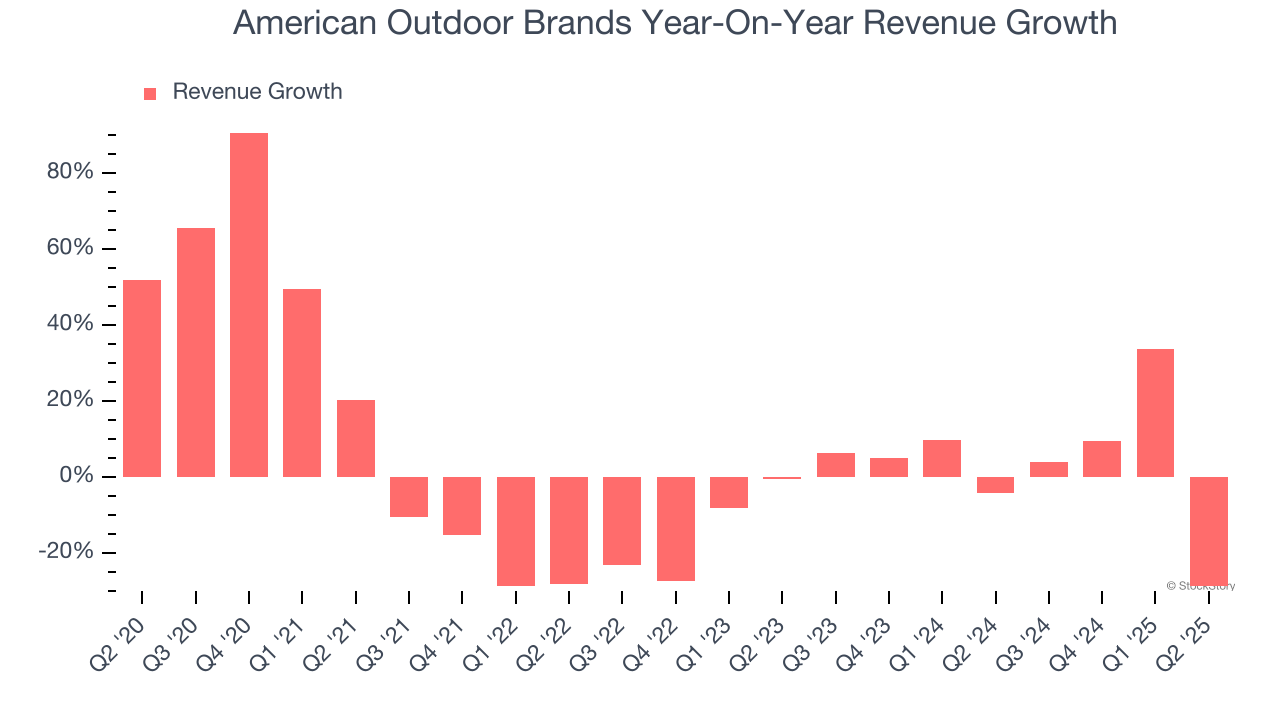
This quarter, American Outdoor Brands missed Wall Street’s estimates and reported a rather uninspiring 28.7% year-on-year revenue decline, generating $29.7 million of revenue.
Looking ahead, sell-side analysts expect revenue to decline by 1.3% over the next 12 months, a deceleration versus the last two years. This projection doesn't excite us and indicates its products and services will face some demand challenges.
Unless you’ve been living under a rock, it should be obvious by now that generative AI is going to have a huge impact on how large corporations do business. While Nvidia and AMD are trading close to all-time highs, we prefer a lesser-known (but still profitable) stock benefiting from the rise of AI. Click here to access our free report one of our favorites growth stories.
Operating Margin
American Outdoor Brands’s operating margin has been trending up over the last 12 months, but it still averaged negative 3.8% over the last two years. This is due to its large expense base and inefficient cost structure.
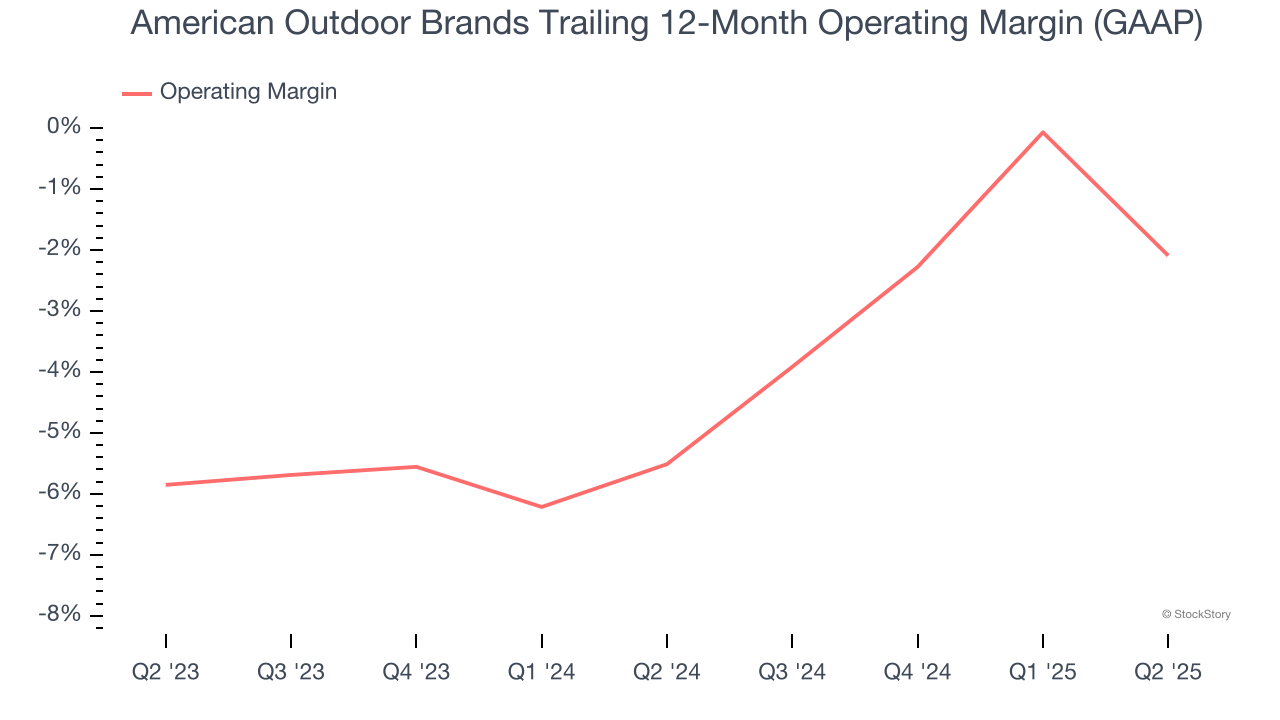
American Outdoor Brands’s operating margin was negative 23% this quarter. The company's consistent lack of profits raise a flag.
Earnings Per Share
We track the long-term change in earnings per share (EPS) for the same reason as long-term revenue growth. Compared to revenue, however, EPS highlights whether a company’s growth is profitable.
American Outdoor Brands’s full-year EPS dropped 225%, or 34.3% annually, over the last four years. We tend to steer our readers away from companies with falling revenue and EPS, where diminishing earnings could imply changing secular trends and preferences. Consumer Discretionary companies are particularly exposed to this, and if the tide turns unexpectedly, American Outdoor Brands’s low margin of safety could leave its stock price susceptible to large downswings.
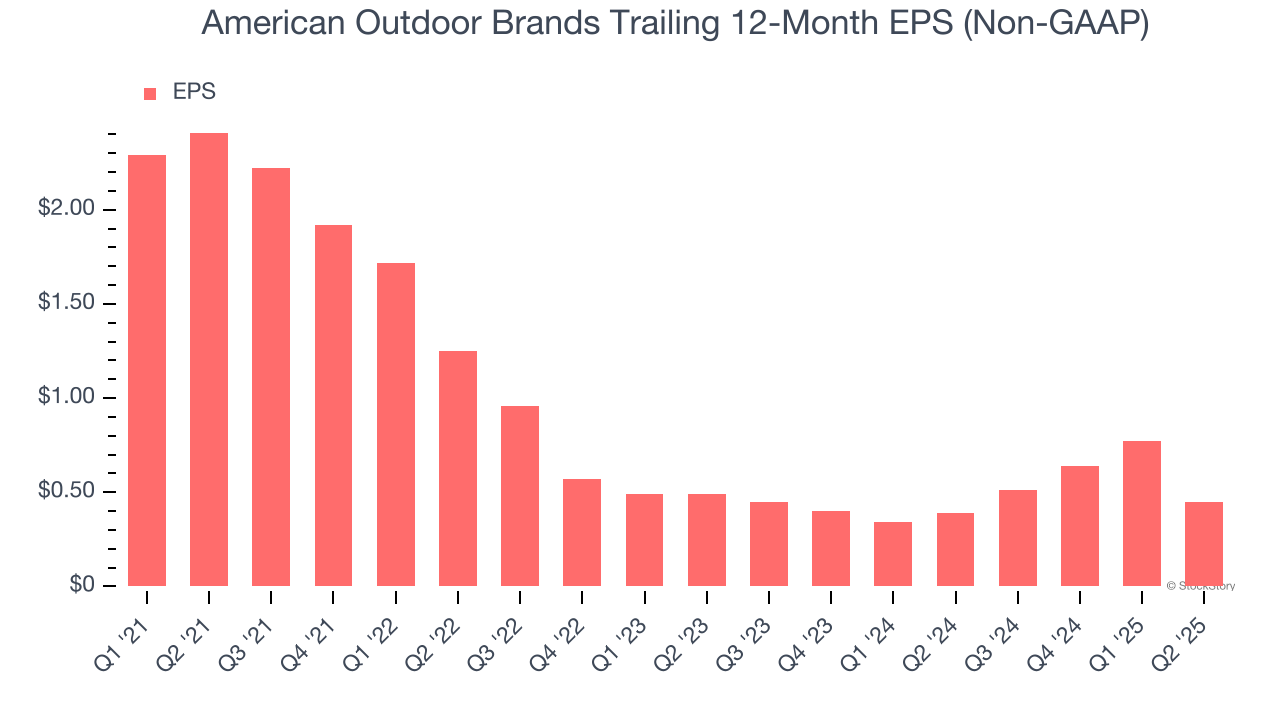
In Q2, American Outdoor Brands reported adjusted EPS of negative $0.26, down from $0.06 in the same quarter last year. This print missed analysts’ estimates. We also like to analyze expected EPS growth based on Wall Street analysts’ consensus projections, but there is insufficient data.
Key Takeaways from American Outdoor Brands’s Q2 Results
We struggled to find many positives in these results. Its revenue missed and its EBITDA fell short of Wall Street’s estimates. Overall, this was a weaker quarter. The stock traded down 4.8% to $9.89 immediately following the results.
American Outdoor Brands didn’t show it’s best hand this quarter, but does that create an opportunity to buy the stock right now? If you’re making that decision, you should consider the bigger picture of valuation, business qualities, as well as the latest earnings. We cover that in our actionable full research report which you can read here, it’s free.