Since September 2020, the S&P 500 has delivered a total return of 91%. But one standout stock has more than doubled the market - over the past five years, Stifel has surged 226% to $112.85 per share. Its momentum hasn’t stopped as it’s also gained 23.2% in the last six months thanks to its solid quarterly results, beating the S&P by 7.4%.
Is there a buying opportunity in Stifel, or does it present a risk to your portfolio? Check out our in-depth research report to see what our analysts have to say, it’s free.
Why Is Stifel Not Exciting?
We’re glad investors have benefited from the price increase, but we're sitting this one out for now. Here are three reasons there are better opportunities than SF and a stock we'd rather own.
1. Long-Term Revenue Growth Disappoints
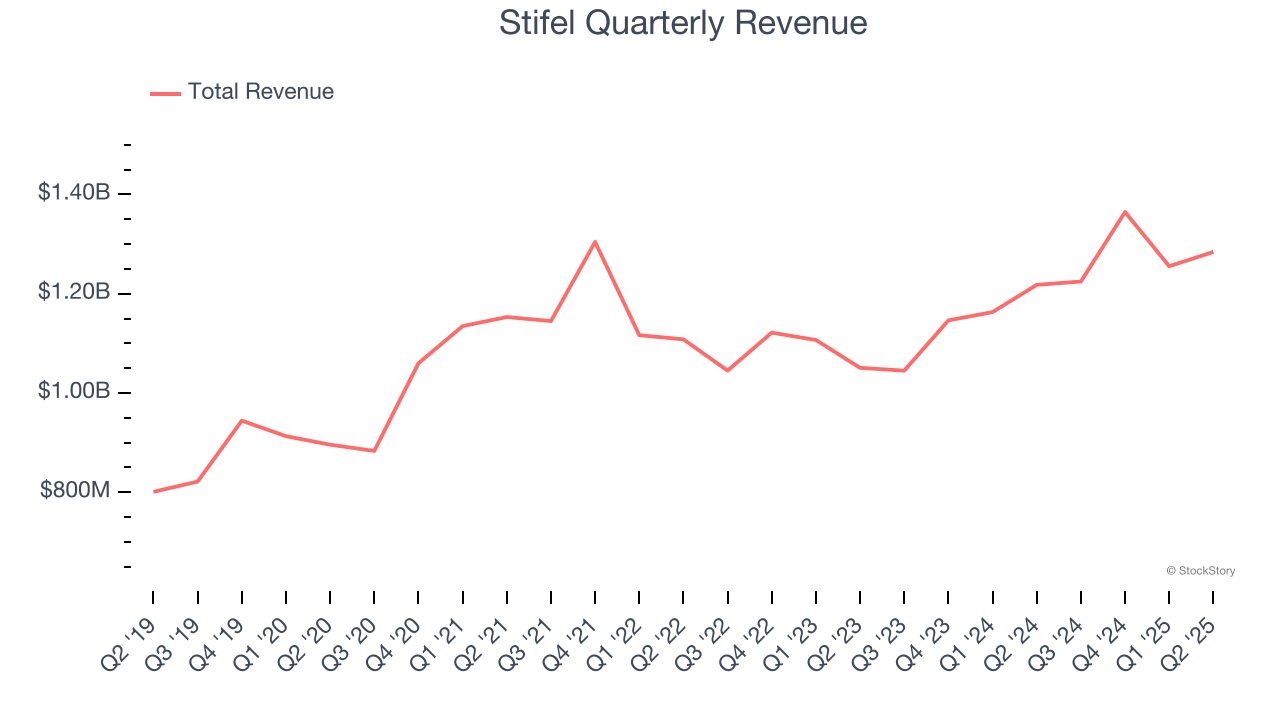
A company’s long-term performance is an indicator of its overall quality. Any business can experience short-term success, but top-performing ones enjoy sustained growth for years.
Over the last five years, Stifel grew its revenue at a mediocre 7.5% compounded annual growth rate. This was below our standard for the financials sector.
2. EPS Barely Growing
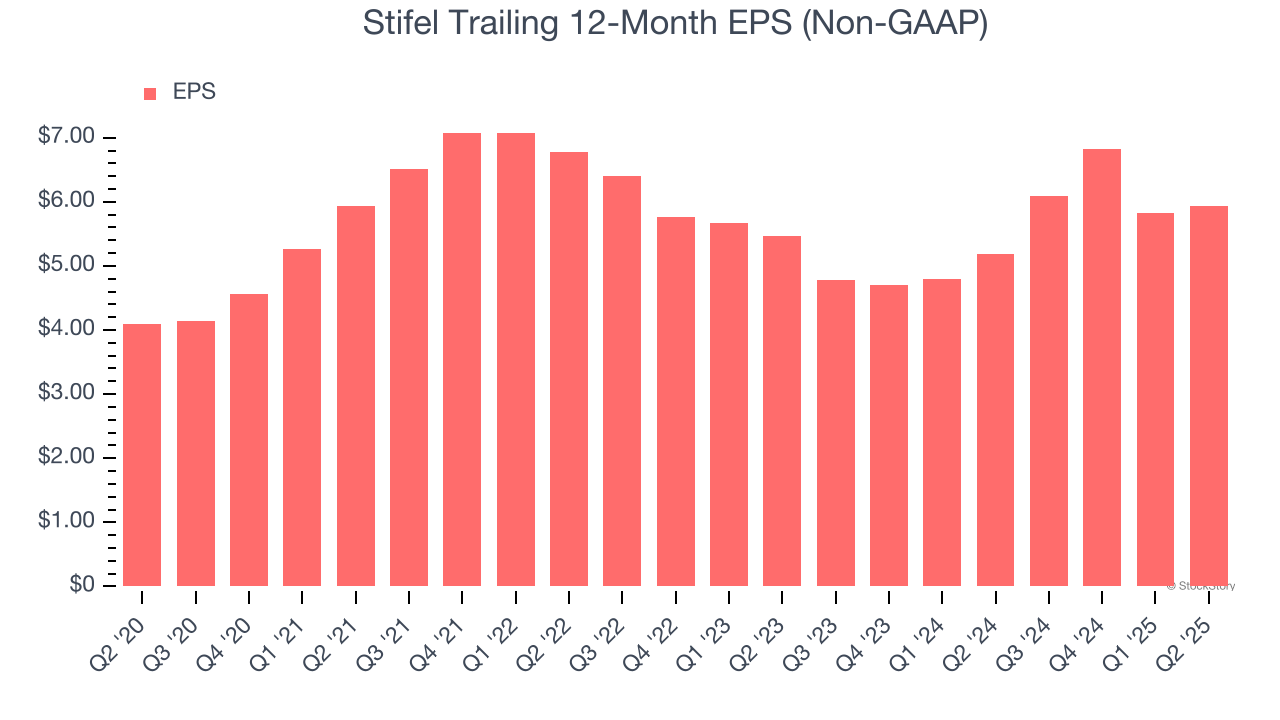
Analyzing the long-term change in earnings per share (EPS) shows whether a company's incremental sales were profitable – for example, revenue could be inflated through excessive spending on advertising and promotions.
Stifel’s unimpressive 7.7% annual EPS growth over the last five years aligns with its revenue performance. This tells us it maintained its per-share profitability as it expanded.
3. Substandard BVPS Growth Indicates Limited Asset Expansion
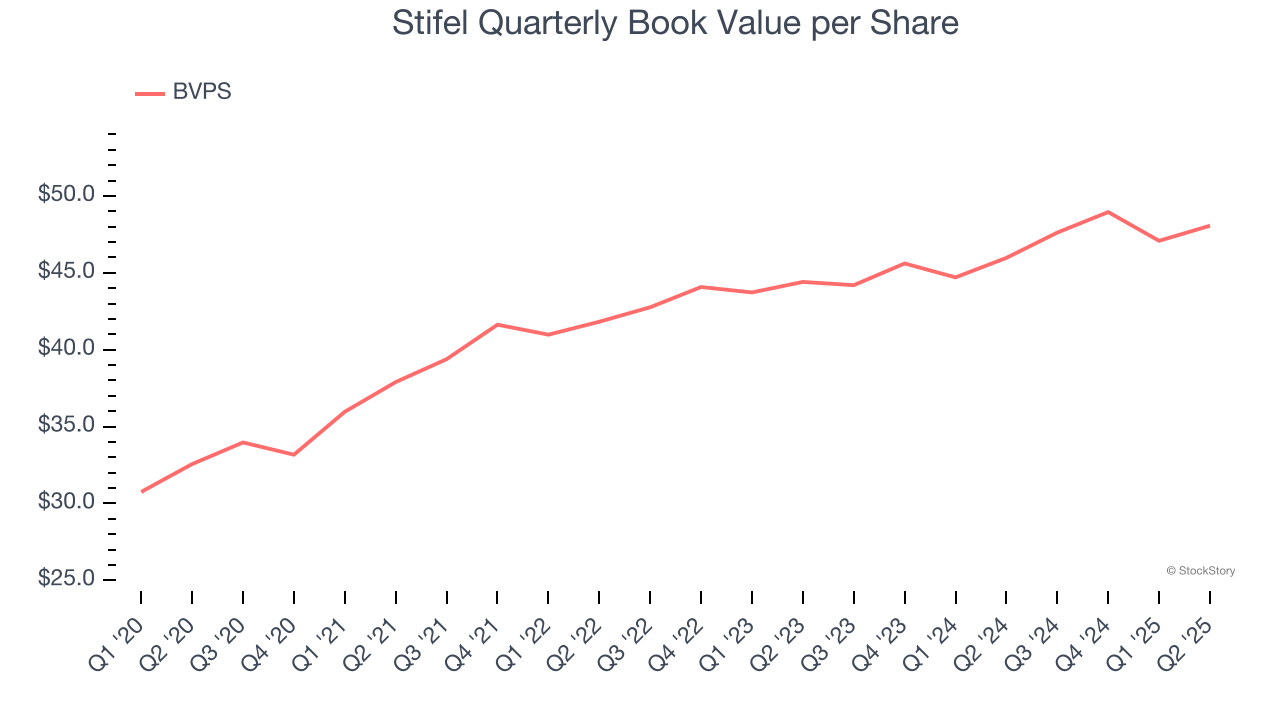
We consider book value per share (BVPS) a critical metric for financial firms. BVPS represents the total net worth per share, providing insight into a company’s financial strength and ability to meet its obligations.
Although Stifel’s BVPS increased by 8.1% annually over the last five years, growth has recently decelerated to a sluggish 4% over the past two years (from $44.41 to $48.07 per share).
Final Judgment
Stifel isn’t a terrible business, but it isn’t one of our picks. With its shares outperforming the market lately, the stock trades at 13.5× forward P/E (or $112.85 per share). This valuation is reasonable, but the company’s shakier fundamentals present too much downside risk. We're fairly confident there are better stocks to buy right now. Let us point you toward one of our top software and edge computing picks.
Stocks We Like More Than Stifel
When Trump unveiled his aggressive tariff plan in April 2025, markets tanked as investors feared a full-blown trade war. But those who panicked and sold missed the subsequent rebound that’s already erased most losses.
Don’t let fear keep you from great opportunities and take a look at Top 6 Stocks for this week. This is a curated list of our High Quality stocks that have generated a market-beating return of 183% over the last five years (as of March 31st 2025).
Stocks that made our list in 2020 include now familiar names such as Nvidia (+1,545% between March 2020 and March 2025) as well as under-the-radar businesses like the once-small-cap company Exlservice (+354% five-year return). Find your next big winner with StockStory today.
StockStory is growing and hiring equity analyst and marketing roles. Are you a 0 to 1 builder passionate about the markets and AI? See the open roles here.