Footwear and accessories discount retailer Designer Brands (NYSE: DBI) met Wall Street’s revenue expectations in Q2 CY2025, but sales fell by 4.2% year on year to $739.8 million. Its non-GAAP profit of $0.34 per share was 52.2% above analysts’ consensus estimates.
Is now the time to buy Designer Brands? Find out by accessing our full research report, it’s free.
Designer Brands (DBI) Q2 CY2025 Highlights:
- Revenue: $739.8 million vs analyst estimates of $737.9 million (4.2% year-on-year decline, in line)
- Adjusted EPS: $0.34 vs analyst estimates of $0.22 (52.2% beat)
- Operating Margin: 3.6%, in line with the same quarter last year
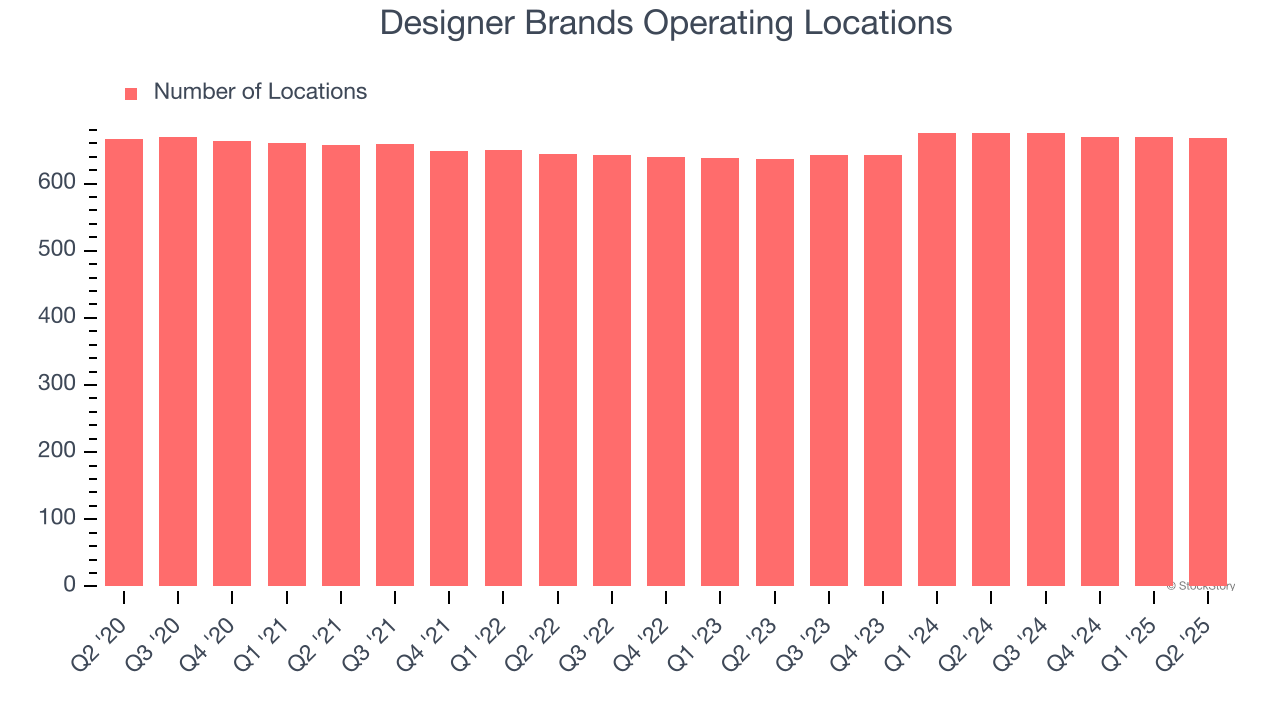
- Locations: 668 at quarter end, down from 676 in the same quarter last year
- Same-Store Sales fell 5% year on year (-1.4% in the same quarter last year)
- Market Capitalization: $203.6 million
"Our second quarter results were highlighted by a 280-basis point sequential improvement in comparable sales from the first quarter, underscoring the impact of our targeted operational initiatives," stated Doug Howe, Chief Executive Officer.
Company Overview
Founded in 1969 as a shoe importer and distributor, Designer Brands (NYSE: DBI) is an American discount retailer focused on footwear and accessories.
Revenue Growth
A company’s long-term sales performance is one signal of its overall quality. Any business can have short-term success, but a top-tier one grows for years.
With $2.92 billion in revenue over the past 12 months, Designer Brands is a small retailer, which sometimes brings disadvantages compared to larger competitors benefiting from economies of scale and negotiating leverage with suppliers.
As you can see below, Designer Brands’s revenue declined by 2.5% per year over the last six years (we compare to 2019 to normalize for COVID-19 impacts) despite opening new stores. This implies its underperformance was driven by lower sales at existing, established locations.
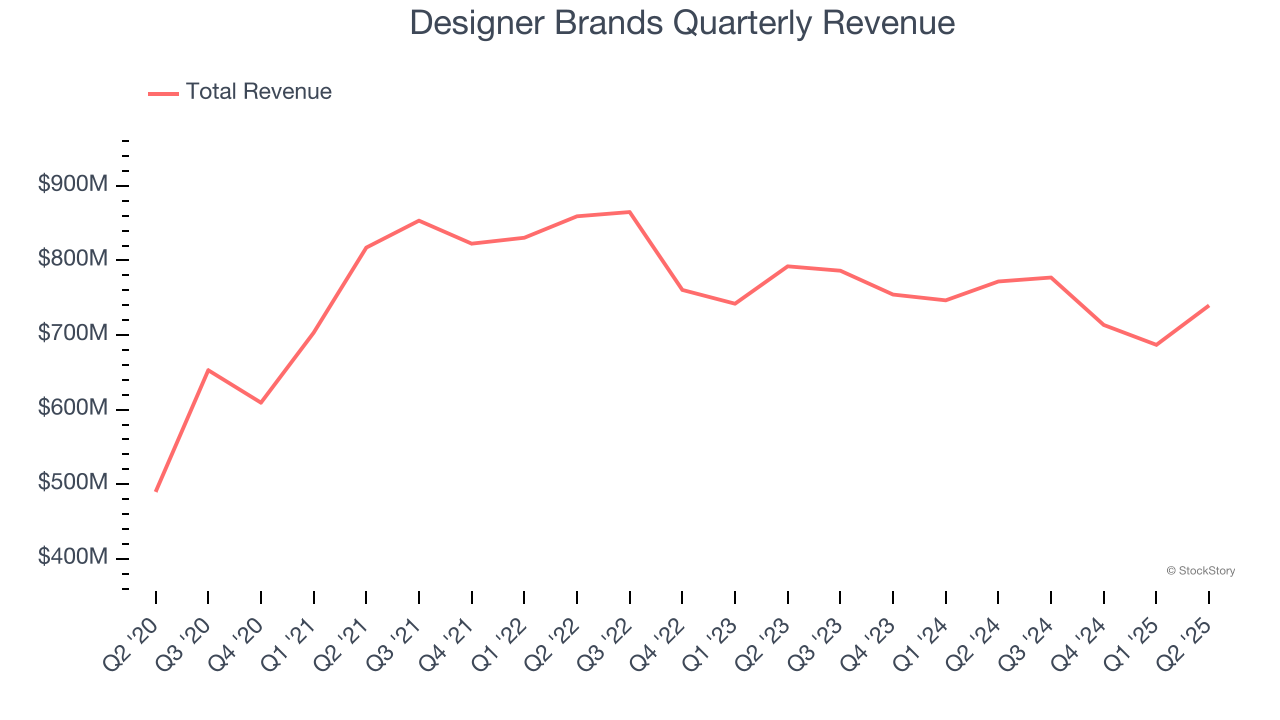
This quarter, Designer Brands reported a rather uninspiring 4.2% year-on-year revenue decline to $739.8 million of revenue, in line with Wall Street’s estimates.
Looking ahead, sell-side analysts expect revenue to remain flat over the next 12 months. Although this projection implies its newer products will catalyze better top-line performance, it is still below the sector average.
Today’s young investors won’t have read the timeless lessons in Gorilla Game: Picking Winners In High Technology because it was written more than 20 years ago when Microsoft and Apple were first establishing their supremacy. But if we apply the same principles, then enterprise software stocks leveraging their own generative AI capabilities may well be the Gorillas of the future. So, in that spirit, we are excited to present our Special Free Report on a profitable, fast-growing enterprise software stock that is already riding the automation wave and looking to catch the generative AI next.
Store Performance
Number of Stores
A retailer’s store count influences how much it can sell and how quickly revenue can grow.
Designer Brands operated 668 locations in the latest quarter. It has opened new stores quickly over the last two years, averaging 2.5% annual growth, faster than the broader consumer retail sector.
When a retailer opens new stores, it usually means it’s investing for growth because demand is greater than supply, especially in areas where consumers may not have a store within reasonable driving distance.
Same-Store Sales
A company's store base only paints one part of the picture. When demand is high, it makes sense to open more. But when demand is low, it’s prudent to close some locations and use the money in other ways. Same-store sales gives us insight into this topic because it measures organic growth for a retailer's e-commerce platform and brick-and-mortar shops that have existed for at least a year.
Designer Brands’s demand has been shrinking over the last two years as its same-store sales have averaged 4.5% annual declines. This performance is concerning - it shows Designer Brands artificially boosts its revenue by building new stores. We’d like to see a company’s same-store sales rise before it takes on the costly, capital-intensive endeavor of expanding its store base.
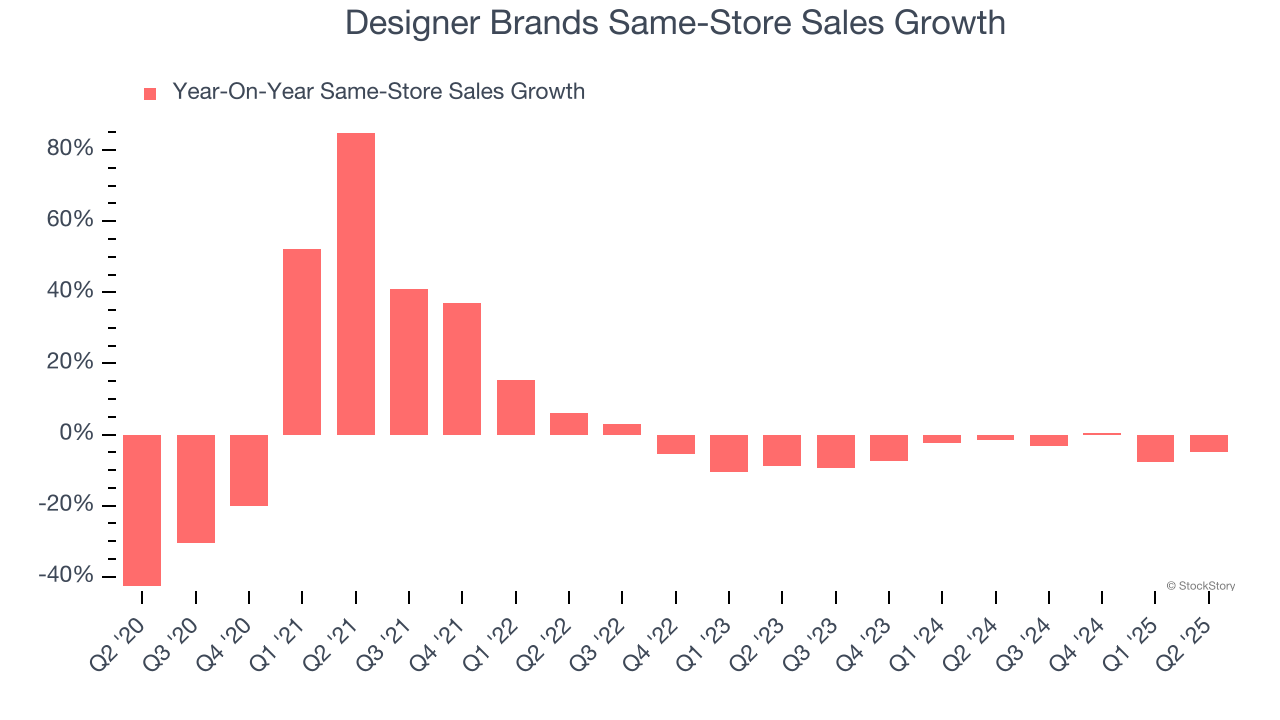
In the latest quarter, Designer Brands’s same-store sales fell by 5% year on year. This performance was more or less in line with its historical levels.
Key Takeaways from Designer Brands’s Q2 Results
It was good to see Designer Brands beat analysts’ EPS expectations this quarter. Overall, we think this was still a solid quarter with some key areas of upside. The stock traded up 9.6% to $4.57 immediately following the results.
Designer Brands may have had a good quarter, but does that mean you should invest right now? The latest quarter does matter, but not nearly as much as longer-term fundamentals and valuation, when deciding if the stock is a buy. We cover that in our actionable full research report which you can read here, it’s free.