Global manufacturing solutions provider Flex (NASDAQ: FLEX) reported Q3 CY2025 results beating Wall Street’s revenue expectations, with sales up 4% year on year to $6.80 billion. Guidance for next quarter’s revenue was better than expected at $6.8 billion at the midpoint, 0.7% above analysts’ estimates. Its non-GAAP profit of $0.79 per share was 4.3% above analysts’ consensus estimates.
Is now the time to buy Flex? Find out by accessing our full research report, it’s free for active Edge members.
Flex (FLEX) Q3 CY2025 Highlights:
- Revenue: $6.80 billion vs analyst estimates of $6.70 billion (4% year-on-year growth, 1.6% beat)
- Adjusted EPS: $0.79 vs analyst estimates of $0.76 (4.3% beat)
- The company lifted its revenue guidance for the full year to $27 billion at the midpoint from $26.5 billion, a 1.9% increase
- Management raised its full-year Adjusted EPS guidance to $3.13 at the midpoint, a 5.7% increase
- Operating Margin: 4.4%, in line with the same quarter last year
- Free Cash Flow Margin: 4.5%, up from 3.3% in the same quarter last year
- Market Capitalization: $24.12 billion
Revathi Advaithi, CEO of Flex, stated: "We achieved a record Q2, and we continue to execute with discipline and deliver value for customers across business segments. As we continue to shift our portfolio toward higher margin businesses, we remain confident in our data center position and ability to offer complete, integrated solutions to the world's leading technology companies as they navigate the AI era."
Company Overview
Originally known as Flextronics until its 2016 rebranding, Flex (NASDAQ: FLEX) is a global manufacturing partner that designs, engineers, and builds products for companies across industries from medical devices to solar trackers.
Revenue Growth
Reviewing a company’s long-term sales performance reveals insights into its quality. Any business can have short-term success, but a top-tier one grows for years.
With $26.33 billion in revenue over the past 12 months, Flex is a behemoth in the business services sector and benefits from economies of scale, giving it an edge in distribution. This also enables it to gain more leverage on its fixed costs than smaller competitors and the flexibility to offer lower prices. However, its scale is a double-edged sword because finding new avenues for growth becomes difficult when you already have a substantial market presence. To accelerate sales, Flex likely needs to optimize its pricing or lean into new offerings and international expansion.
As you can see below, Flex’s sales grew at a sluggish 2.7% compounded annual growth rate over the last five years. This shows it failed to generate demand in any major way and is a rough starting point for our analysis.
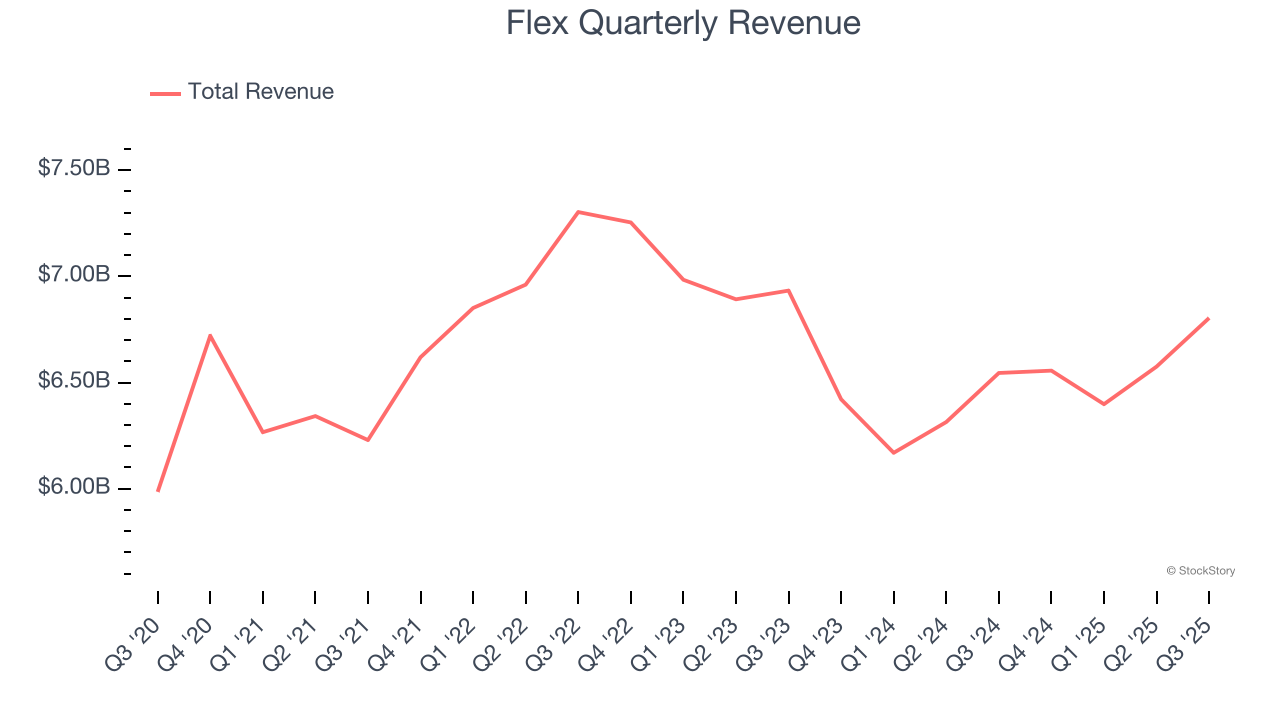
Long-term growth is the most important, but within business services, a half-decade historical view may miss new innovations or demand cycles. Flex’s performance shows it grew in the past but relinquished its gains over the last two years, as its revenue fell by 3.1% annually. 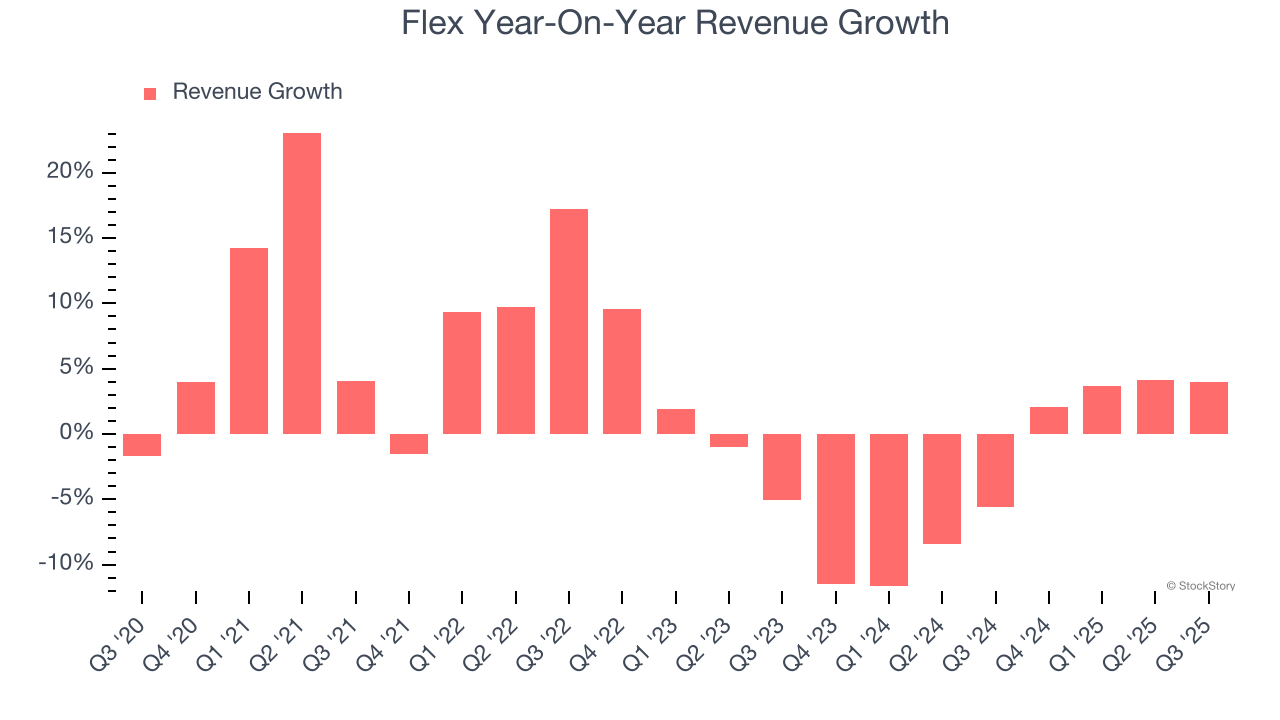
This quarter, Flex reported modest year-on-year revenue growth of 4% but beat Wall Street’s estimates by 1.6%. Company management is currently guiding for a 3.7% year-on-year increase in sales next quarter.
Looking further ahead, sell-side analysts expect revenue to grow 3.2% over the next 12 months. Although this projection suggests its newer products and services will fuel better top-line performance, it is still below the sector average.
Here at StockStory, we certainly understand the potential of thematic investing. Diverse winners from Microsoft (MSFT) to Alphabet (GOOG), Coca-Cola (KO) to Monster Beverage (MNST) could all have been identified as promising growth stories with a megatrend driving the growth. So, in that spirit, we’ve identified a relatively under-the-radar profitable growth stock benefiting from the rise of AI, available to you FREE via this link.
Operating Margin
Flex’s operating margin has been trending up over the last 12 months and averaged 3.9% over the last five years. The company’s higher efficiency is a breath of fresh air, but its suboptimal cost structure means it still sports lousy profitability for a business services business.
Looking at the trend in its profitability, Flex’s operating margin might fluctuated slightly but has generally stayed the same over the last five years. This raises questions about the company’s expense base because its revenue growth should have given it leverage on its fixed costs, resulting in better economies of scale and profitability.
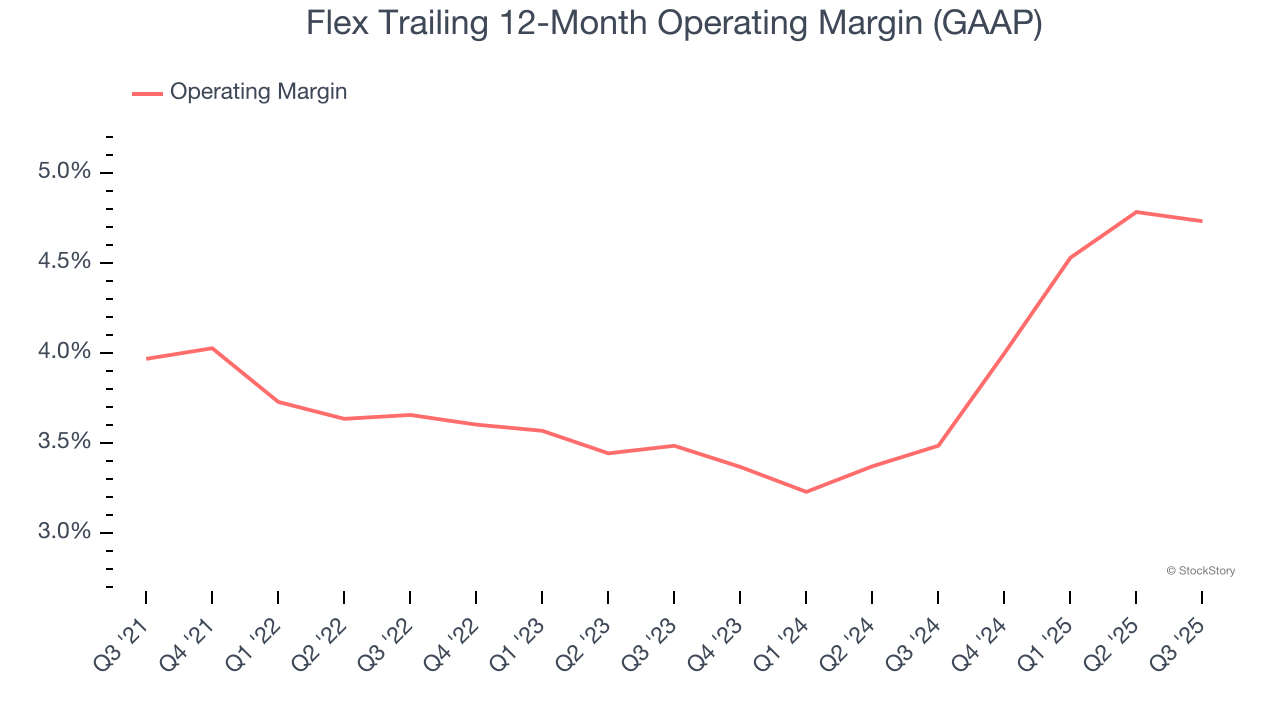
This quarter, Flex generated an operating margin profit margin of 4.4%, in line with the same quarter last year. This indicates the company’s overall cost structure has been relatively stable.
Earnings Per Share
Revenue trends explain a company’s historical growth, but the long-term change in earnings per share (EPS) points to the profitability of that growth – for example, a company could inflate its sales through excessive spending on advertising and promotions.
Flex’s EPS grew at an astounding 19.2% compounded annual growth rate over the last five years, higher than its 2.7% annualized revenue growth. This tells us the company became more profitable on a per-share basis as it expanded.
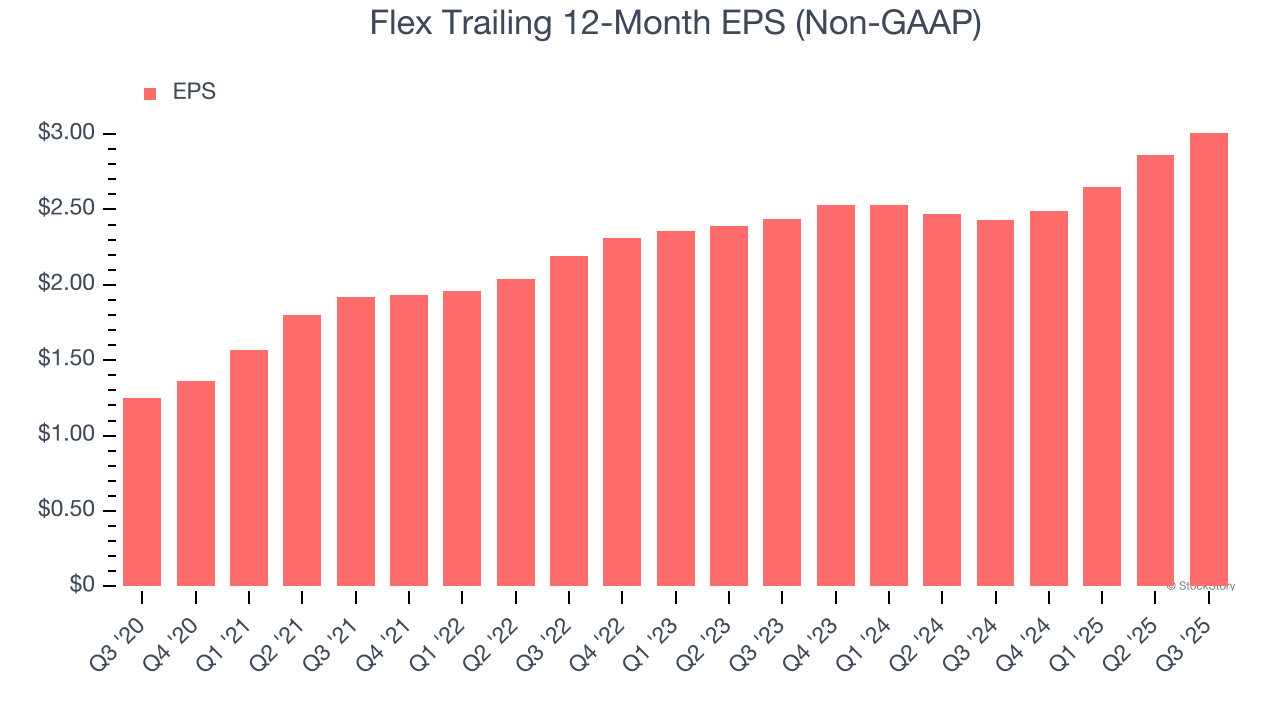
Like with revenue, we analyze EPS over a more recent period because it can provide insight into an emerging theme or development for the business.
For Flex, its two-year annual EPS growth of 11.1% was lower than its five-year trend. We hope its growth can accelerate in the future.
In Q3, Flex reported adjusted EPS of $0.79, up from $0.64 in the same quarter last year. This print beat analysts’ estimates by 4.3%. Over the next 12 months, Wall Street expects Flex’s full-year EPS of $3.01 to grow 4%.
Key Takeaways from Flex’s Q3 Results
We enjoyed seeing Flex beat analysts’ full-year EPS guidance expectations this quarter. We were also happy its revenue outperformed Wall Street’s estimates. Overall, this print had some key positives. The market seemed to be hoping for more, and the stock traded down 3.5% to $62 immediately following the results.
Is Flex an attractive investment opportunity at the current price? The latest quarter does matter, but not nearly as much as longer-term fundamentals and valuation, when deciding if the stock is a buy. We cover that in our actionable full research report which you can read here, it’s free for active Edge members.