
Transportation company Schneider (NYSE: SNDR) reported Q3 CY2025 results topping the market’s revenue expectations, with sales up 10.4% year on year to $1.45 billion. Its non-GAAP profit of $0.12 per share was 41.3% below analysts’ consensus estimates.
Is now the time to buy Schneider? Find out by accessing our full research report, it’s free for active Edge members.
Schneider (SNDR) Q3 CY2025 Highlights:
- Revenue: $1.45 billion vs analyst estimates of $1.43 billion (10.4% year-on-year growth, 1.4% beat)
- Adjusted EPS: $0.12 vs analyst expectations of $0.20 (41.3% miss)
- Adjusted EBITDA: $148.9 million vs analyst estimates of $165.9 million (10.3% margin, 10.2% miss)
- Operating Margin: 2.4%, in line with the same quarter last year
- Free Cash Flow Margin: 5.2%, down from 8.6% in the same quarter last year
- Market Capitalization: $3.97 billion
Company Overview
Employing thousands of drivers across the country to make deliveries, Schneider (NYSE: SNDR) makes full truckload and intermodal deliveries regionally and across borders.
Revenue Growth
Examining a company’s long-term performance can provide clues about its quality. Any business can put up a good quarter or two, but the best consistently grow over the long haul. Unfortunately, Schneider’s 4.8% annualized revenue growth over the last five years was tepid. This was below our standard for the industrials sector and is a rough starting point for our analysis.
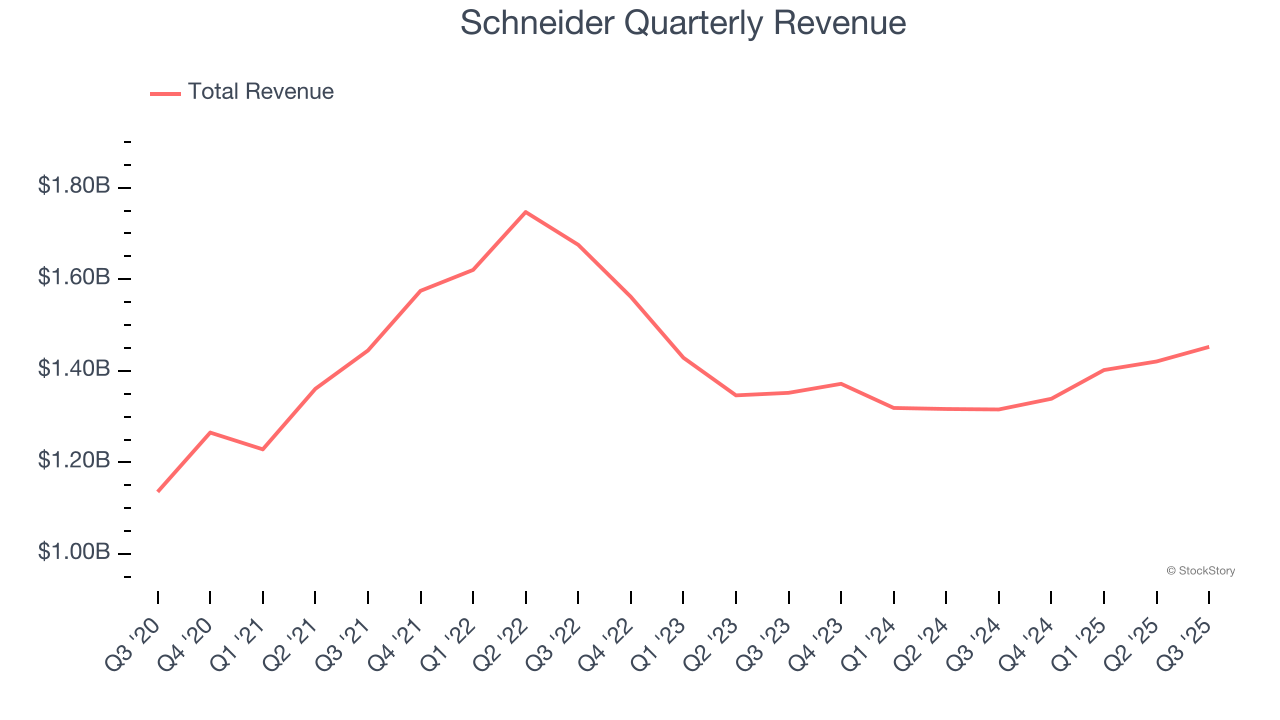
We at StockStory place the most emphasis on long-term growth, but within industrials, a half-decade historical view may miss cycles, industry trends, or a company capitalizing on catalysts such as a new contract win or a successful product line. Schneider’s recent performance shows its demand has slowed as its revenue was flat over the last two years. We also note many other Ground Transportation businesses have faced declining sales because of cyclical headwinds. While Schneider’s growth wasn’t the best, it did do better than its peers. 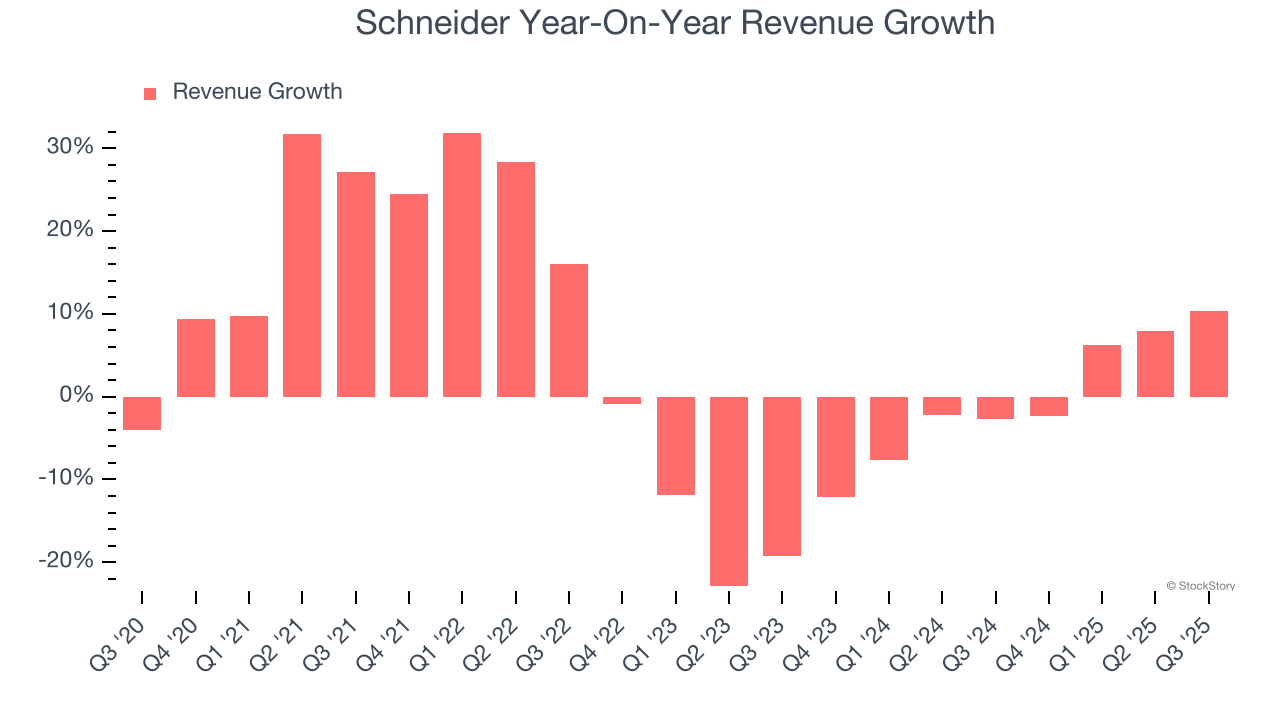
We can better understand the company’s revenue dynamics by analyzing its most important segments, Truckload
and Logistics, which are 43% and 22.9% of revenue. Over the last two years, Schneider’s Truckload
revenue (road freight) averaged 6.3% year-on-year growth. On the other hand, its Logistics revenue (supply chain, warehousing) averaged 4.5% declines. 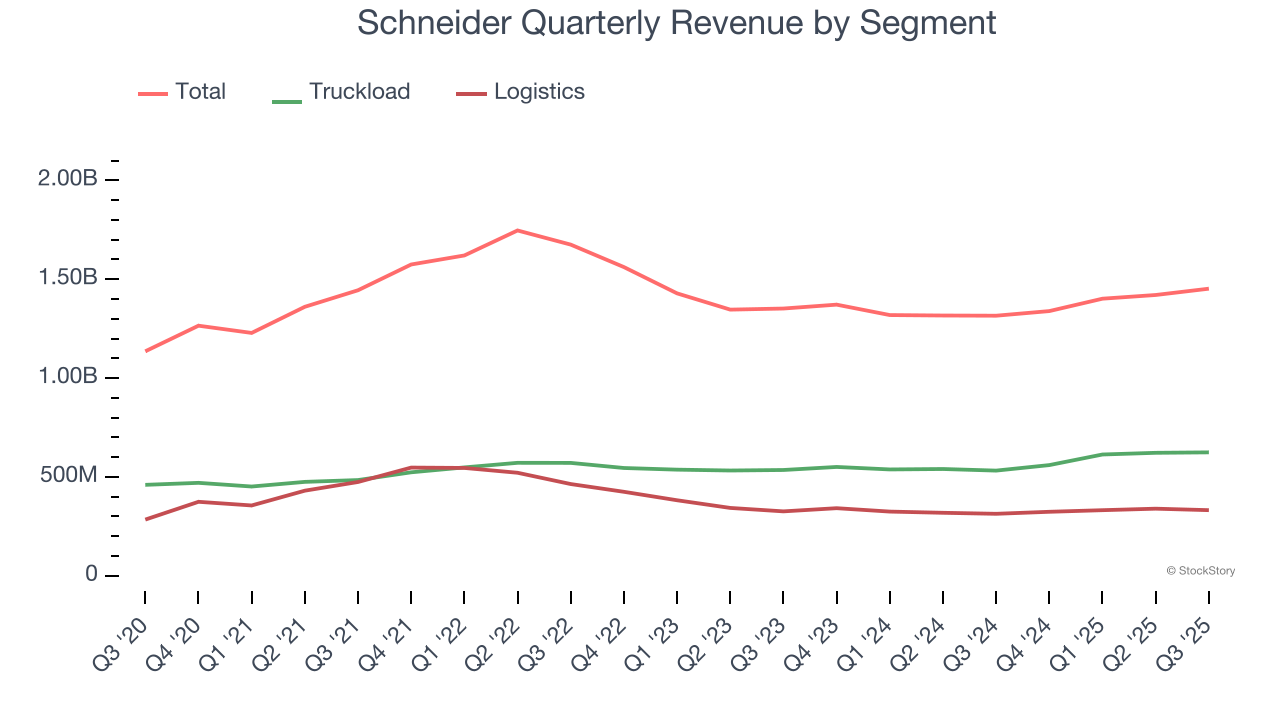
This quarter, Schneider reported year-on-year revenue growth of 10.4%, and its $1.45 billion of revenue exceeded Wall Street’s estimates by 1.4%.
Looking ahead, sell-side analysts expect revenue to grow 4.5% over the next 12 months. Although this projection suggests its newer products and services will catalyze better top-line performance, it is still below average for the sector.
Today’s young investors won’t have read the timeless lessons in Gorilla Game: Picking Winners In High Technology because it was written more than 20 years ago when Microsoft and Apple were first establishing their supremacy. But if we apply the same principles, then enterprise software stocks leveraging their own generative AI capabilities may well be the Gorillas of the future. So, in that spirit, we are excited to present our Special Free Report on a profitable, fast-growing enterprise software stock that is already riding the automation wave and looking to catch the generative AI next.
Operating Margin
Operating margin is one of the best measures of profitability because it tells us how much money a company takes home after procuring and manufacturing its products, marketing and selling those products, and most importantly, keeping them relevant through research and development.
Schneider was profitable over the last five years but held back by its large cost base. Its average operating margin of 6.4% was weak for an industrials business. This result isn’t too surprising given its low gross margin as a starting point.
Looking at the trend in its profitability, Schneider’s operating margin decreased by 5.6 percentage points over the last five years. This raises questions about the company’s expense base because its revenue growth should have given it leverage on its fixed costs, resulting in better economies of scale and profitability. We’ve noticed many Ground Transportation companies also saw their margins fall (along with revenue, as mentioned above) because the cycle turned in the wrong direction, but Schneider’s performance was poor no matter how you look at it. It shows that costs were rising and it couldn’t pass them onto its customers.
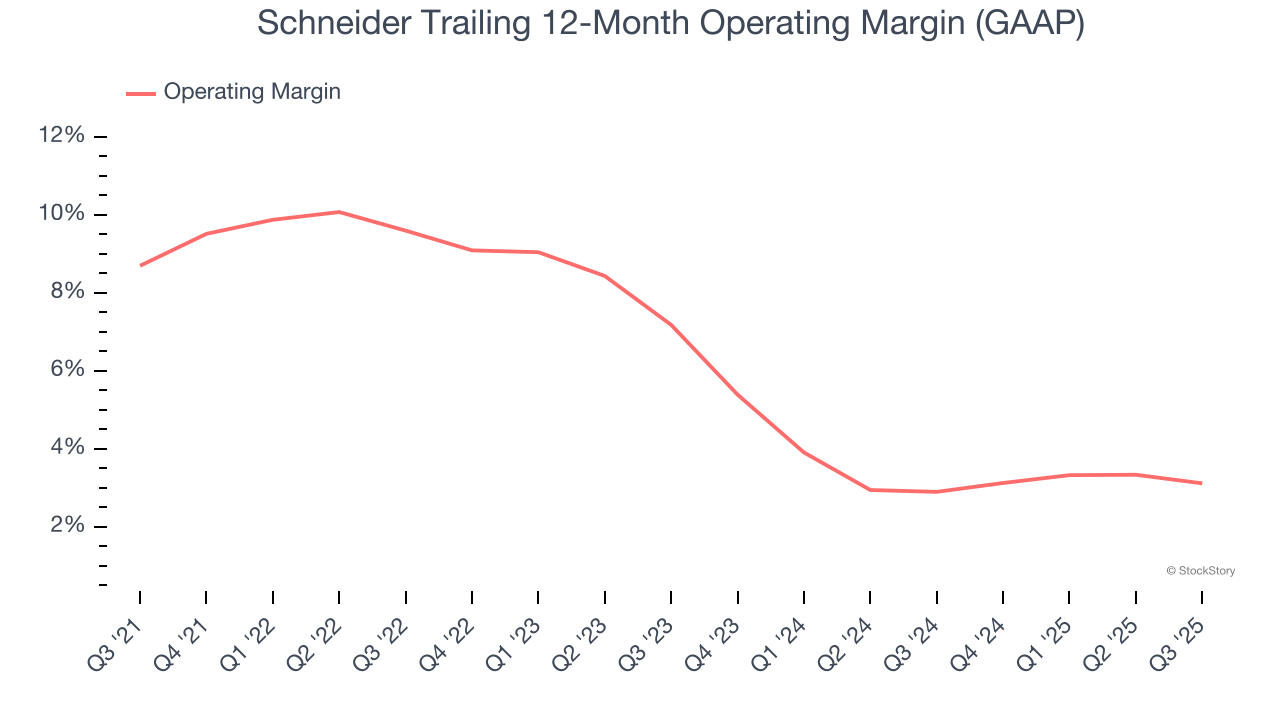
This quarter, Schneider generated an operating margin profit margin of 2.4%, in line with the same quarter last year. This indicates the company’s cost structure has recently been stable.
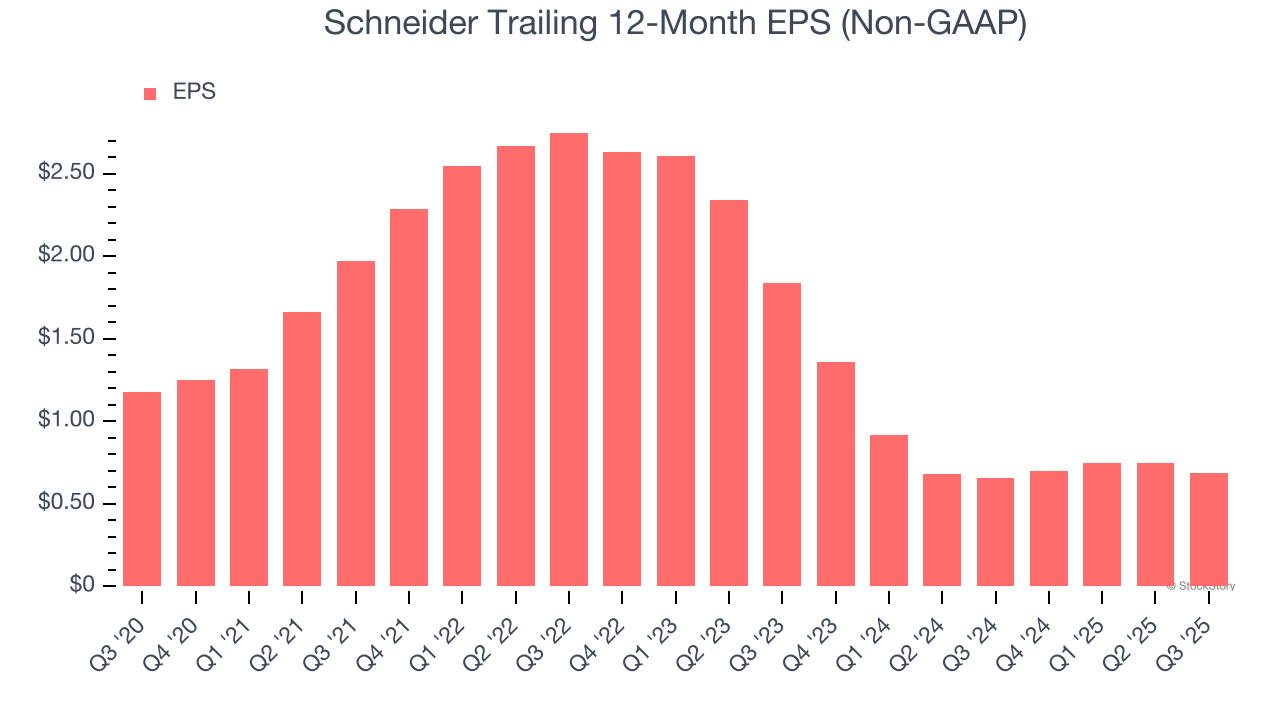
Earnings Per Share
Revenue trends explain a company’s historical growth, but the long-term change in earnings per share (EPS) points to the profitability of that growth – for example, a company could inflate its sales through excessive spending on advertising and promotions.
Sadly for Schneider, its EPS declined by 10.2% annually over the last five years while its revenue grew by 4.8%. This tells us the company became less profitable on a per-share basis as it expanded due to non-fundamental factors such as interest expenses and taxes.
We can take a deeper look into Schneider’s earnings to better understand the drivers of its performance. As we mentioned earlier, Schneider’s operating margin was flat this quarter but declined by 5.6 percentage points over the last five years. This was the most relevant factor (aside from the revenue impact) behind its lower earnings; interest expenses and taxes can also affect EPS but don’t tell us as much about a company’s fundamentals.
Like with revenue, we analyze EPS over a more recent period because it can provide insight into an emerging theme or development for the business.
For Schneider, its two-year annual EPS declines of 38.8% show it’s continued to underperform. These results were bad no matter how you slice the data.
In Q3, Schneider reported adjusted EPS of $0.12, down from $0.18 in the same quarter last year. This print missed analysts’ estimates. Over the next 12 months, Wall Street expects Schneider’s full-year EPS of $0.69 to grow 56.6%.
Key Takeaways from Schneider’s Q3 Results
It was good to see Schneider narrowly top analysts’ revenue expectations this quarter. On the other hand, its EBITDA missed and its EPS fell short of Wall Street’s estimates. Overall, this was a softer quarter. The stock traded down 7.7% to $20.89 immediately after reporting.
The latest quarter from Schneider’s wasn’t that good. One earnings report doesn’t define a company’s quality, though, so let’s explore whether the stock is a buy at the current price. We think that the latest quarter is only one piece of the longer-term business quality puzzle. Quality, when combined with valuation, can help determine if the stock is a buy. We cover that in our actionable full research report which you can read here, it’s free for active Edge members.