
HR outsourcing provider Insperity (NYSE: NSP) met Wall Streets revenue expectations in Q3 CY2025, with sales up 4% year on year to $1.62 billion. Its non-GAAP loss of $0.20 per share was significantly below analysts’ consensus estimates.
Is now the time to buy Insperity? Find out by accessing our full research report, it’s free for active Edge members.
Insperity (NSP) Q3 CY2025 Highlights:
- Revenue: $1.62 billion vs analyst estimates of $1.63 billion (4% year-on-year growth, in line)
- Adjusted EPS: -$0.20 vs analyst estimates of $0.22 (significant miss)
- Adjusted EBITDA: $10 million vs analyst estimates of $28.56 million (0.6% margin, 65% miss)
- Management lowered its full-year Adjusted EPS guidance to $1.16 at the midpoint, a 46.5% decrease
- EBITDA guidance for the full year is $136 million at the midpoint, below analyst estimates of $183.2 million
- Operating Margin: -1.5%, down from 0.1% in the same quarter last year
- Market Capitalization: $1.66 billion
“We are actively working to position Insperity for sustainable profitability at normal historical levels as we execute on our plan in response to unexpected, elevated healthcare cost trend. We are simultaneously taking assertive actions, including through the new contract with UnitedHealthcare, and will continue to focus on attracting and retaining the right clients at the right price and prudently managing expenses,” said Paul J. Sarvadi, Insperity chairman and chief executive officer.
Company Overview
Pioneering the professional employer organization (PEO) industry it helped establish, Insperity (NYSE: NSP) provides human resources outsourcing services to small and medium-sized businesses, handling payroll, benefits, compliance, and HR administration.
Revenue Growth
A company’s long-term sales performance can indicate its overall quality. Any business can put up a good quarter or two, but the best consistently grow over the long haul.
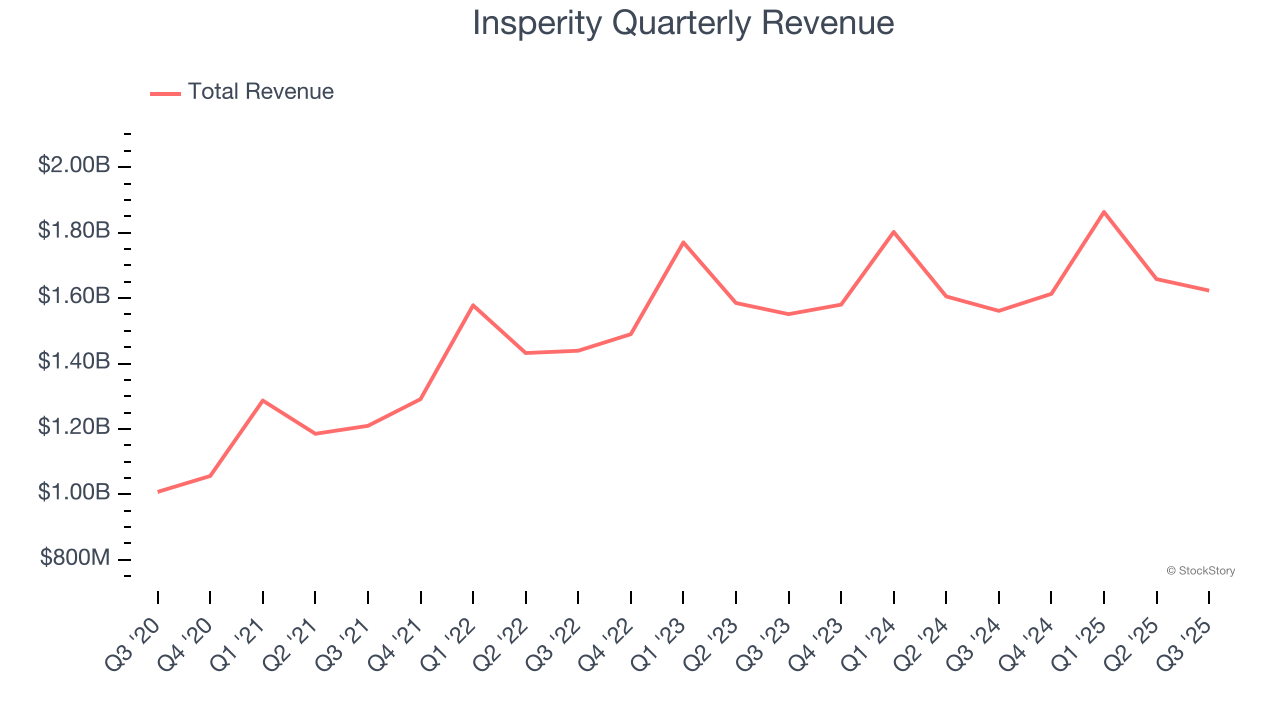
With $6.76 billion in revenue over the past 12 months, Insperity is one of the larger companies in the business services industry and benefits from a well-known brand that influences purchasing decisions.
As you can see below, Insperity’s 9.4% annualized revenue growth over the last five years was impressive. This shows it had high demand, a useful starting point for our analysis.
We at StockStory place the most emphasis on long-term growth, but within business services, a half-decade historical view may miss recent innovations or disruptive industry trends. Insperity’s recent performance shows its demand has slowed significantly as its annualized revenue growth of 2.8% over the last two years was well below its five-year trend. 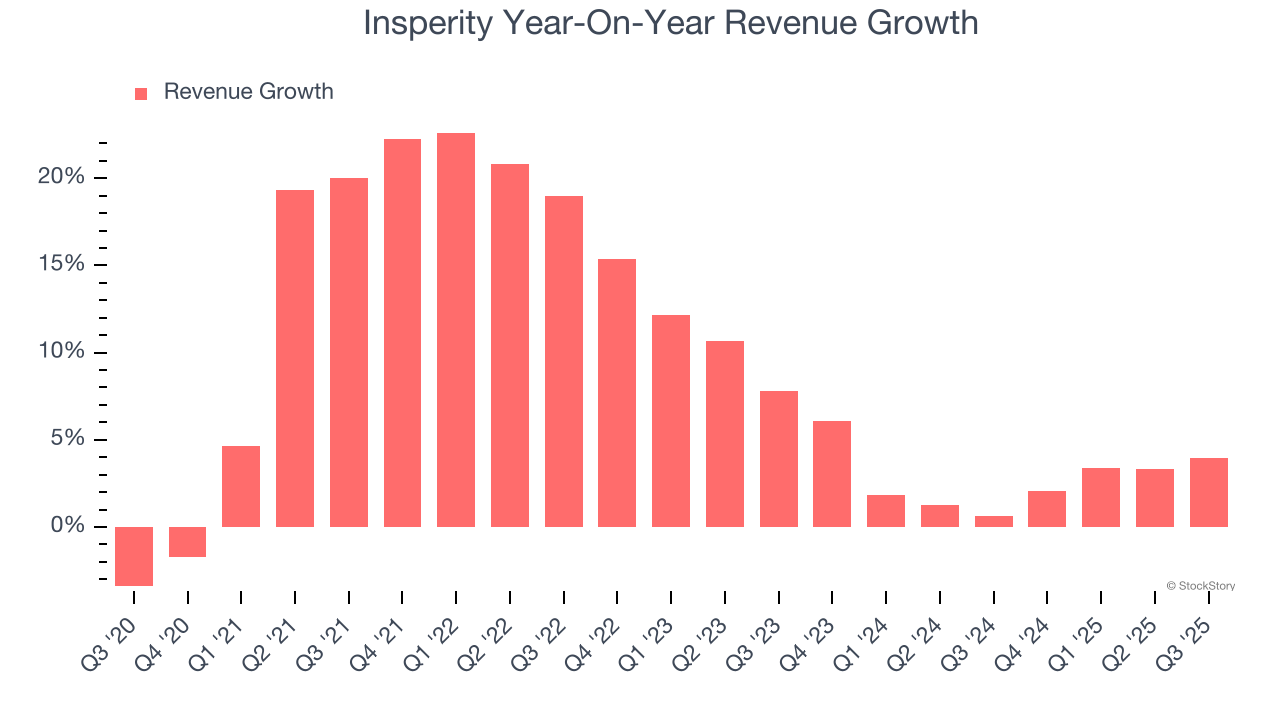
This quarter, Insperity grew its revenue by 4% year on year, and its $1.62 billion of revenue was in line with Wall Street’s estimates.
Looking ahead, sell-side analysts expect revenue to grow 4.6% over the next 12 months. Although this projection indicates its newer products and services will fuel better top-line performance, it is still below average for the sector.
Microsoft, Alphabet, Coca-Cola, Monster Beverage—all began as under-the-radar growth stories riding a massive trend. We’ve identified the next one: a profitable AI semiconductor play Wall Street is still overlooking. Go here for access to our full report.
Operating Margin
Insperity was profitable over the last five years but held back by its large cost base. Its average operating margin of 2.7% was weak for a business services business.
Looking at the trend in its profitability, Insperity’s operating margin decreased by 3.2 percentage points over the last five years. This raises questions about the company’s expense base because its revenue growth should have given it leverage on its fixed costs, resulting in better economies of scale and profitability. Insperity’s performance was poor no matter how you look at it - it shows that costs were rising and it couldn’t pass them onto its customers.
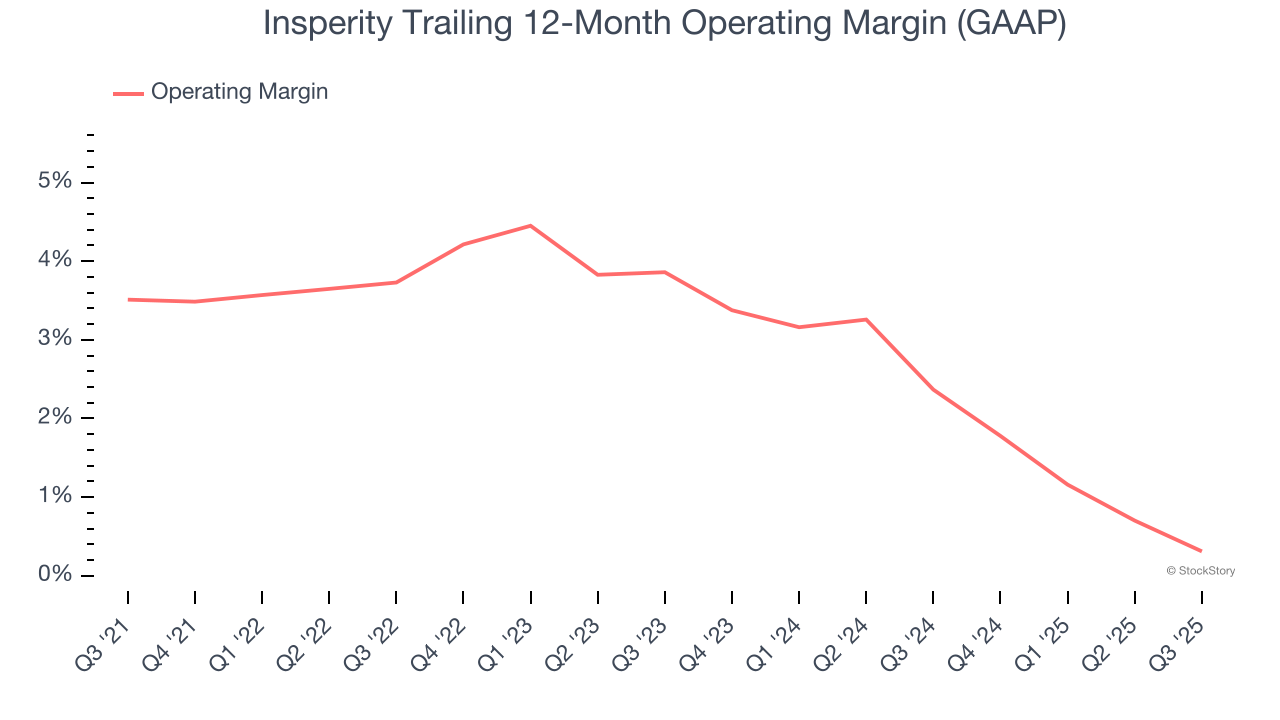
In Q3, Insperity generated an operating margin profit margin of negative 1.5%, down 1.6 percentage points year on year. This reduction is quite minuscule and indicates the company’s overall cost structure has been relatively stable.
Earnings Per Share
We track the long-term change in earnings per share (EPS) for the same reason as long-term revenue growth. Compared to revenue, however, EPS highlights whether a company’s growth is profitable.
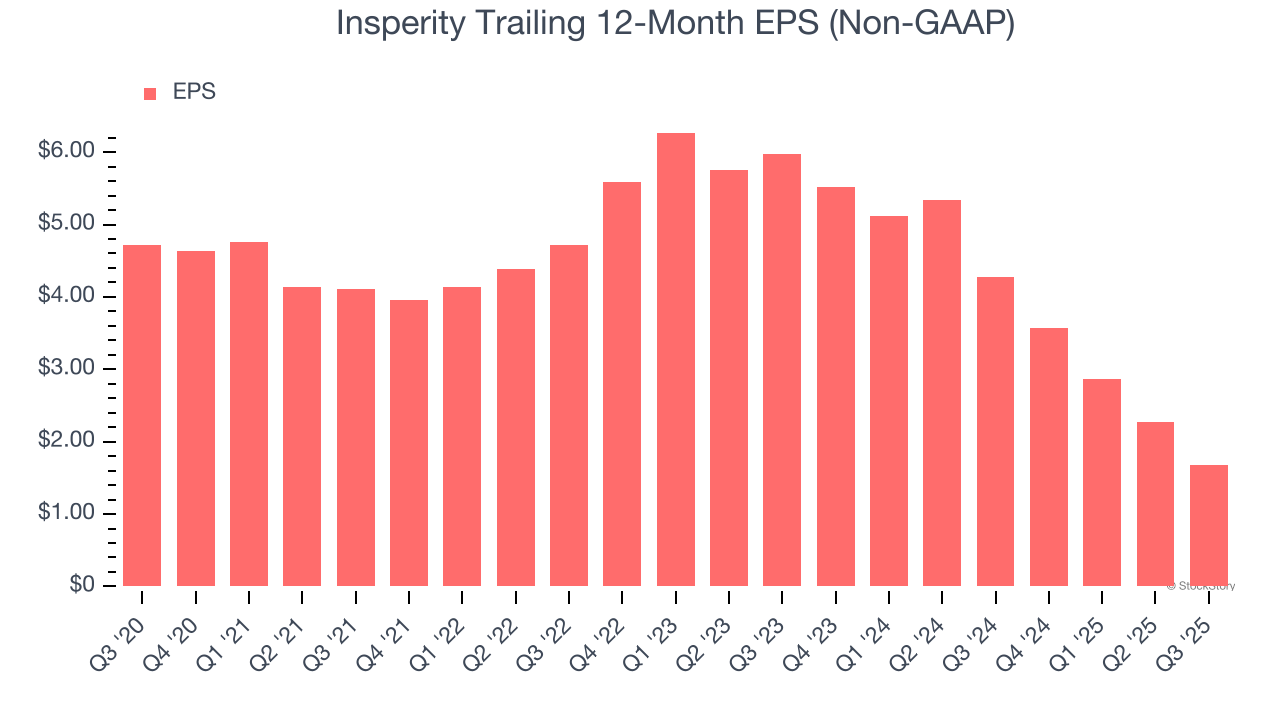
Sadly for Insperity, its EPS declined by 18.7% annually over the last five years while its revenue grew by 9.4%. This tells us the company became less profitable on a per-share basis as it expanded.
We can take a deeper look into Insperity’s earnings to better understand the drivers of its performance. As we mentioned earlier, Insperity’s operating margin declined by 3.2 percentage points over the last five years. This was the most relevant factor (aside from the revenue impact) behind its lower earnings; interest expenses and taxes can also affect EPS but don’t tell us as much about a company’s fundamentals.
Like with revenue, we analyze EPS over a more recent period because it can provide insight into an emerging theme or development for the business.
For Insperity, its two-year annual EPS declines of 47% show it’s continued to underperform. These results were bad no matter how you slice the data.
In Q3, Insperity reported adjusted EPS of negative $0.20, down from $0.39 in the same quarter last year. This print missed analysts’ estimates. Over the next 12 months, Wall Street expects Insperity’s full-year EPS of $1.68 to grow 61.6%.
Key Takeaways from Insperity’s Q3 Results
We struggled to find many positives in these results. While revenue in the quarter was in line, EPS fell short. Additionally, the company's full-year EPS guidance missed and its EPS guidance for next quarter fell short of Wall Street’s estimates. Overall, this quarter could have been better. The stock traded down 25.7% to $33.48 immediately after reporting.
Insperity underperformed this quarter, but does that create an opportunity to invest right now? When making that decision, it’s important to consider its valuation, business qualities, as well as what has happened in the latest quarter. We cover that in our actionable full research report which you can read here, it’s free for active Edge members.