
Real estate brokerage and services firm Marcus & Millichap (NYSE: MMI) met Wall Streets revenue expectations in Q3 CY2025, with sales up 15.1% year on year to $193.9 million. Its GAAP profit of $0.01 per share was 80% below analysts’ consensus estimates.
Is now the time to buy Marcus & Millichap? Find out by accessing our full research report, it’s free for active Edge members.
Marcus & Millichap (MMI) Q3 CY2025 Highlights:
- Revenue: $193.9 million vs analyst estimates of $193.8 million (15.1% year-on-year growth, in line)
- EPS (GAAP): $0.01 vs analyst expectations of $0.05 (80% miss)
- Adjusted EBITDA: $6.89 million vs analyst estimates of $600,000 (3.6% margin, significant beat)
- Operating Margin: -1.2%, up from -6.8% in the same quarter last year
- Market Capitalization: $1.15 billion
Company Overview
Founded in 1971, Marcus & Millichap (NYSE: MMI) specializes in commercial real estate investment sales, financing, research, and advisory services.
Revenue Growth
A company’s long-term sales performance can indicate its overall quality. Any business can experience short-term success, but top-performing ones enjoy sustained growth for years. Over the last five years, Marcus & Millichap grew its sales at a weak 1.3% compounded annual growth rate. This fell short of our benchmarks and is a rough starting point for our analysis.
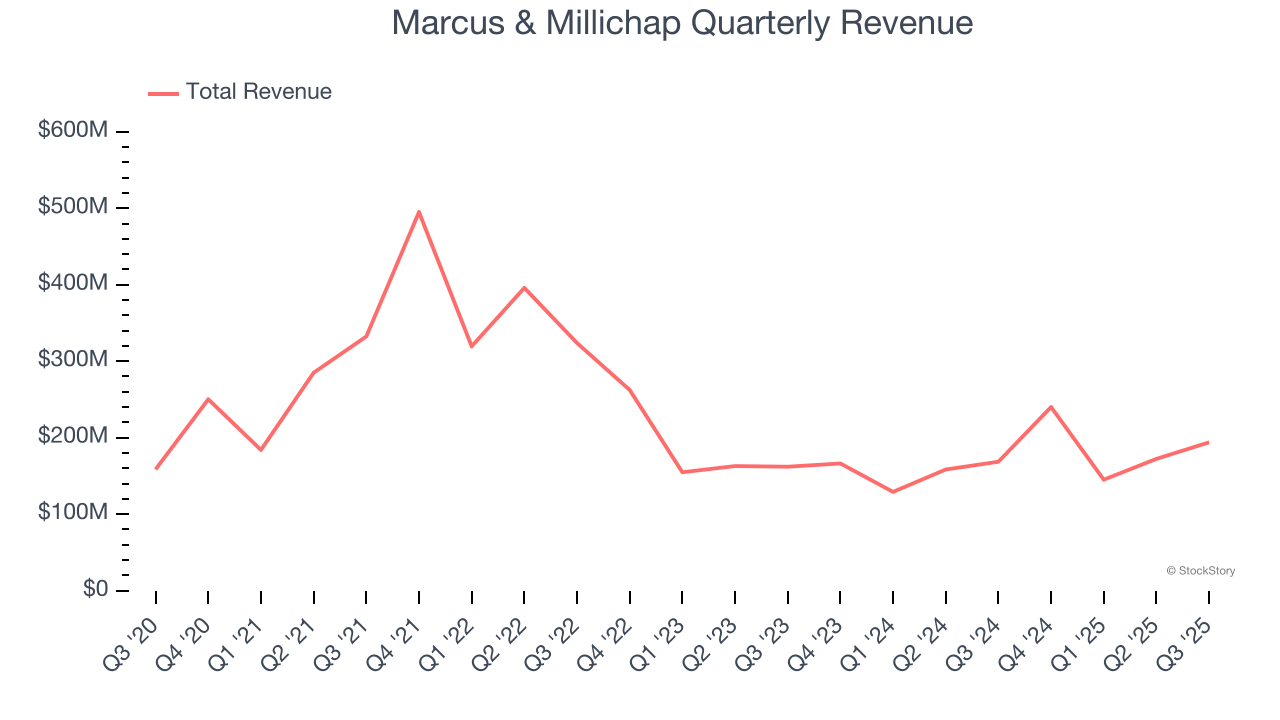
Long-term growth is the most important, but within consumer discretionary, product cycles are short and revenue can be hit-driven due to rapidly changing trends and consumer preferences. Marcus & Millichap’s recent performance shows its demand has slowed as its revenue was flat over the last two years. 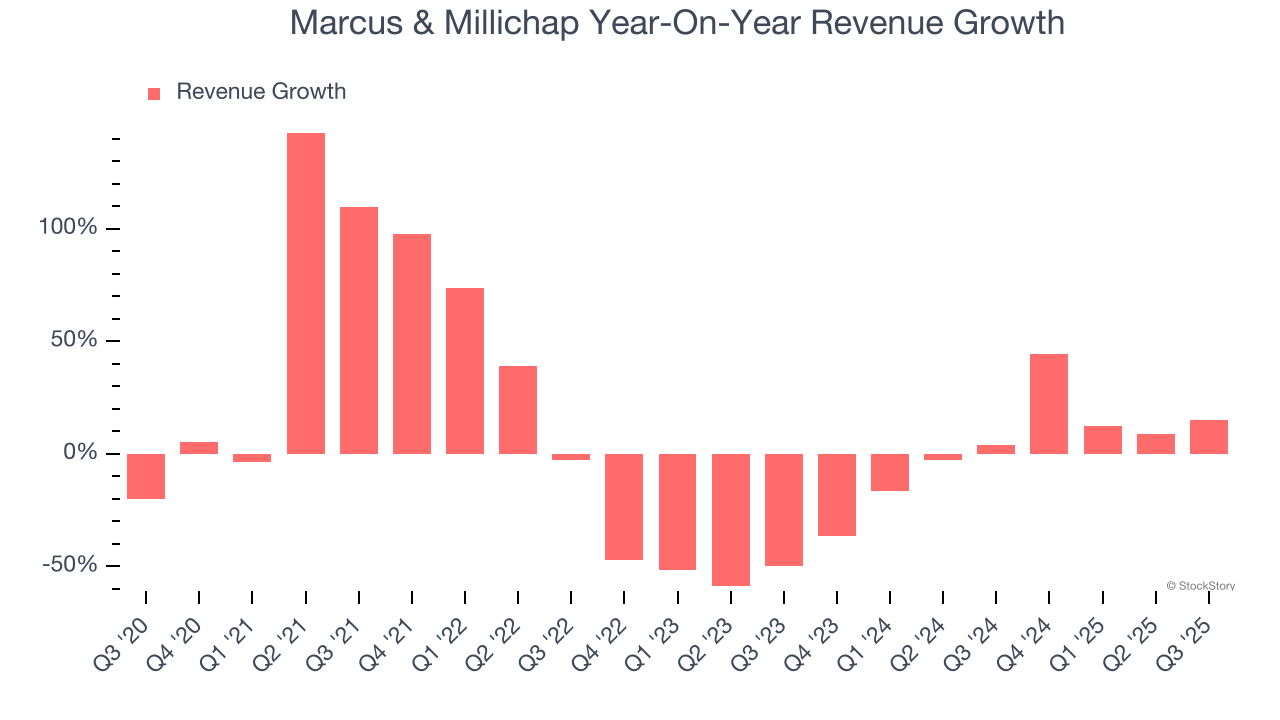
We can better understand the company’s revenue dynamics by analyzing its most important segments, Brokerage and Financing, which are 83.6% and 13.6% of revenue. Over the last two years, Marcus & Millichap’s Brokerage revenue (commission fees) averaged 10.5% year-on-year growth while its Financing revenue (financing fees) averaged 32.3% growth. 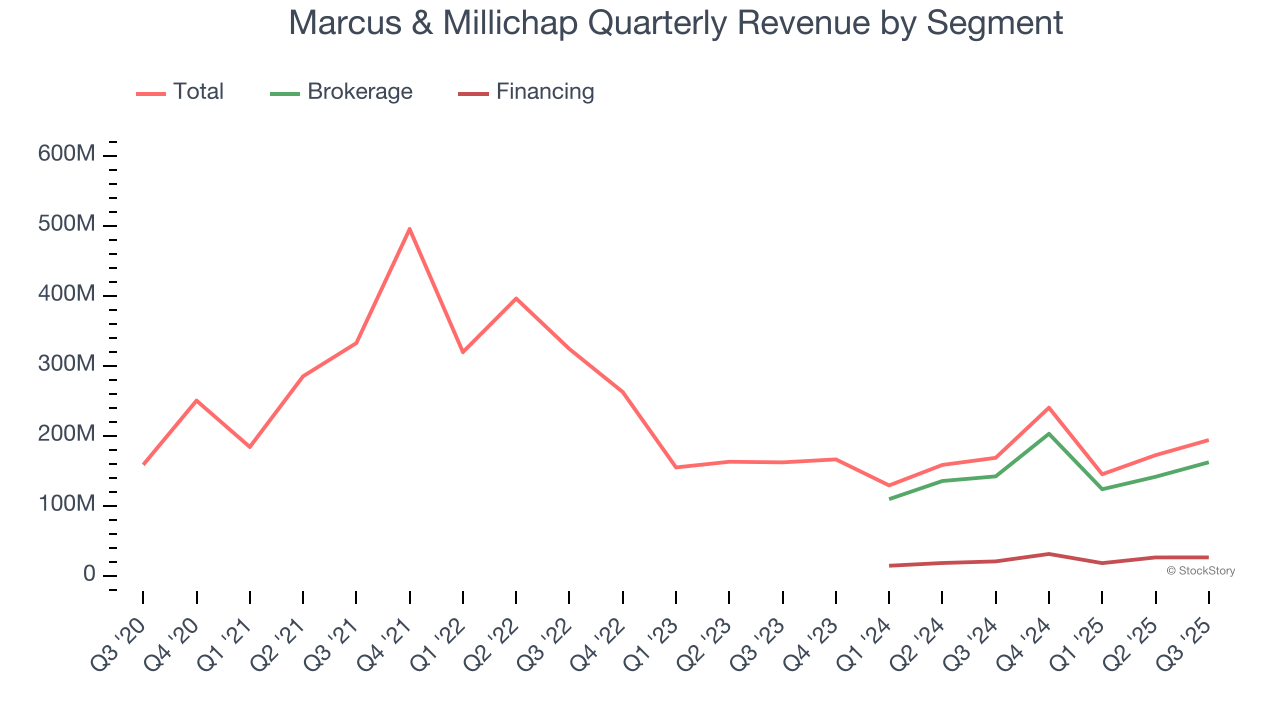
This quarter, Marcus & Millichap’s year-on-year revenue growth was 15.1%, and its $193.9 million of revenue was in line with Wall Street’s estimates.
Looking ahead, sell-side analysts expect revenue to grow 13.8% over the next 12 months, an improvement versus the last two years. This projection is above average for the sector and implies its newer products and services will spur better top-line performance.
While Wall Street chases Nvidia at all-time highs, an under-the-radar semiconductor supplier is dominating a critical AI component these giants can’t build without. Click here to access our free report one of our favorites growth stories.
Operating Margin
Operating margin is a key measure of profitability. Think of it as net income - the bottom line - excluding the impact of taxes and interest on debt, which are less connected to business fundamentals.
Marcus & Millichap’s operating margin has been trending up over the last 12 months, but it still averaged negative 5.8% over the last two years. This is due to its large expense base and inefficient cost structure.
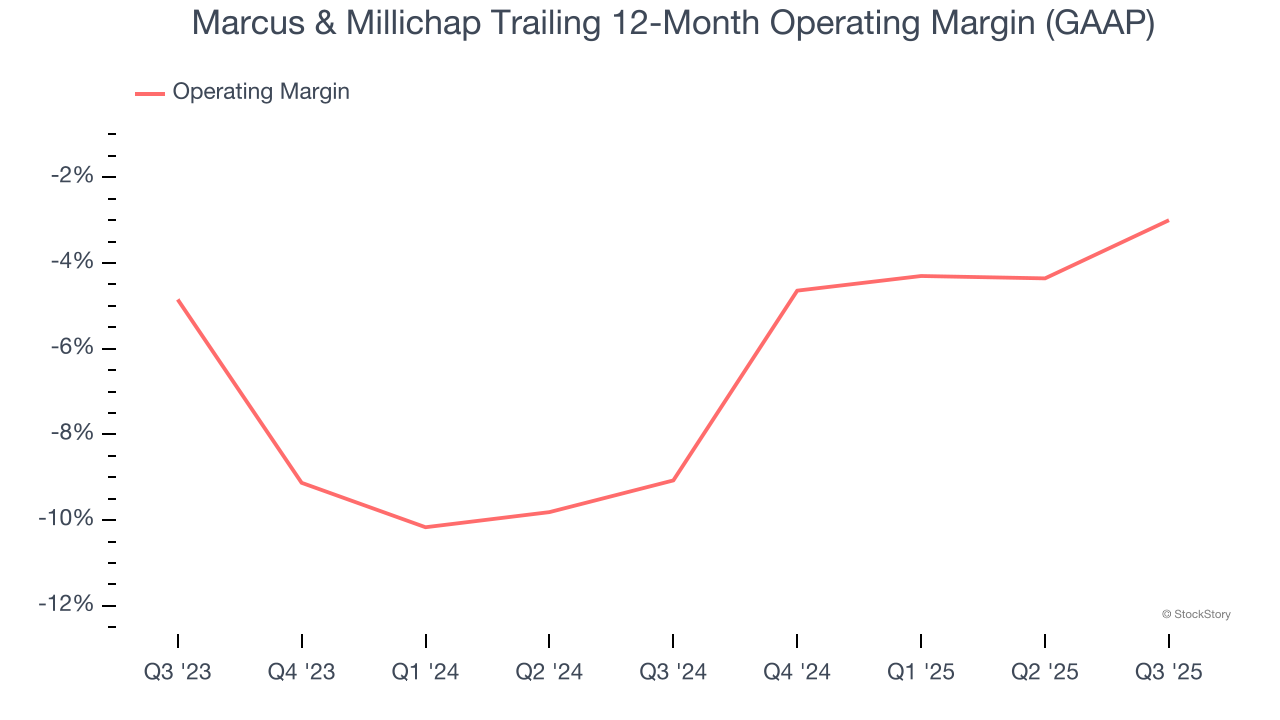
In Q3, Marcus & Millichap generated a negative 1.2% operating margin. The company's consistent lack of profits raise a flag.
Earnings Per Share
We track the long-term change in earnings per share (EPS) for the same reason as long-term revenue growth. Compared to revenue, however, EPS highlights whether a company’s growth is profitable.
Sadly for Marcus & Millichap, its EPS declined by 16.6% annually over the last five years while its revenue grew by 1.3%. This tells us the company became less profitable on a per-share basis as it expanded due to non-fundamental factors such as interest expenses and taxes.
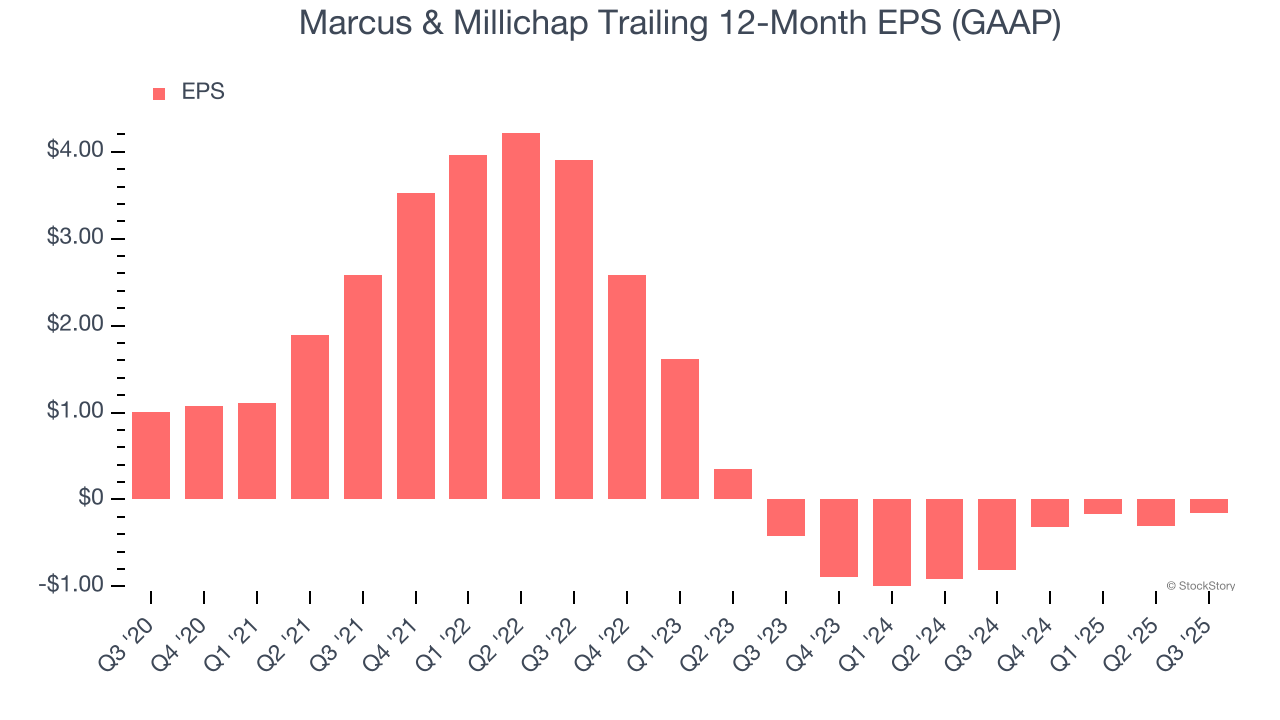
In Q3, Marcus & Millichap reported EPS of $0.01, up from negative $0.14 in the same quarter last year. Despite growing year on year, this print missed analysts’ estimates. Over the next 12 months, Wall Street is optimistic. Analysts forecast Marcus & Millichap’s full-year EPS of negative $0.16 will flip to positive $0.53.
Key Takeaways from Marcus & Millichap’s Q3 Results
We were impressed by how significantly Marcus & Millichap blew past analysts’ EBITDA expectations this quarter. On the other hand, its EPS missed. Zooming out, we think this was a mixed quarter. The stock remained flat at $29.48 immediately following the results.
Should you buy the stock or not? The latest quarter does matter, but not nearly as much as longer-term fundamentals and valuation, when deciding if the stock is a buy. We cover that in our actionable full research report which you can read here, it’s free for active Edge members.