
This week has seen markets do a lot of bouncing around, driven like a cattle truck down a washboard road by the latest social media posts from Washington, D.C. As opposed to 24 hours ago when Watson was buying most commodity markets, early Thursday morning finds funds on the sell side. In some cases, on an increase in overnight volume (e.g. soybeans). This highlights another connection between soybeans and cattle[i], with both market sectors vulnerable to the US administration’s social media posts. With that in mind, in an interview this week I was asked if I had had a chance to “dig through” the latest US-China “deal”, and what my thoughts were. My answer was yes, and that it was like digging through one of those piles of used corn in a feed lot pen, if you understand what I’m saying.
Returning to the theme of what was posted when the US president couldn’t sleep early Thursday morning, December gold rallied more than $50 off its overnight low pre-dawn, the soybean market spent the entire session – so far – in the red. To recap this week: Wednesday saw the January issue close 12.75 cents higher, erasing Tuesday’s lower close after finishing 19.0 cents in the green Monday. The National Soybean Index came in last night at $10.58, also up 12.75 cents for the day, making the overnight selloff in futures more interesting. January dropped as much as 14.25 cents on what looked to be renewed commercial selling but had trimmed is loss to 9.75 cents at this writing. Why would commercial traders be selling if everything is as wonderful as the US president and Ag Secretary continue to say? First and foremost, there could be a modicum of exaggeration in official statements (Can you tell I’m trying to be nice?). Second, the ebb and flow of commercial activity is standard, but can be skewed by nonstandard fund activity similar to what soybeans have seen the past month or so. I’ll say it again, this is similar to what we saw last year at this time. So, there’s that.
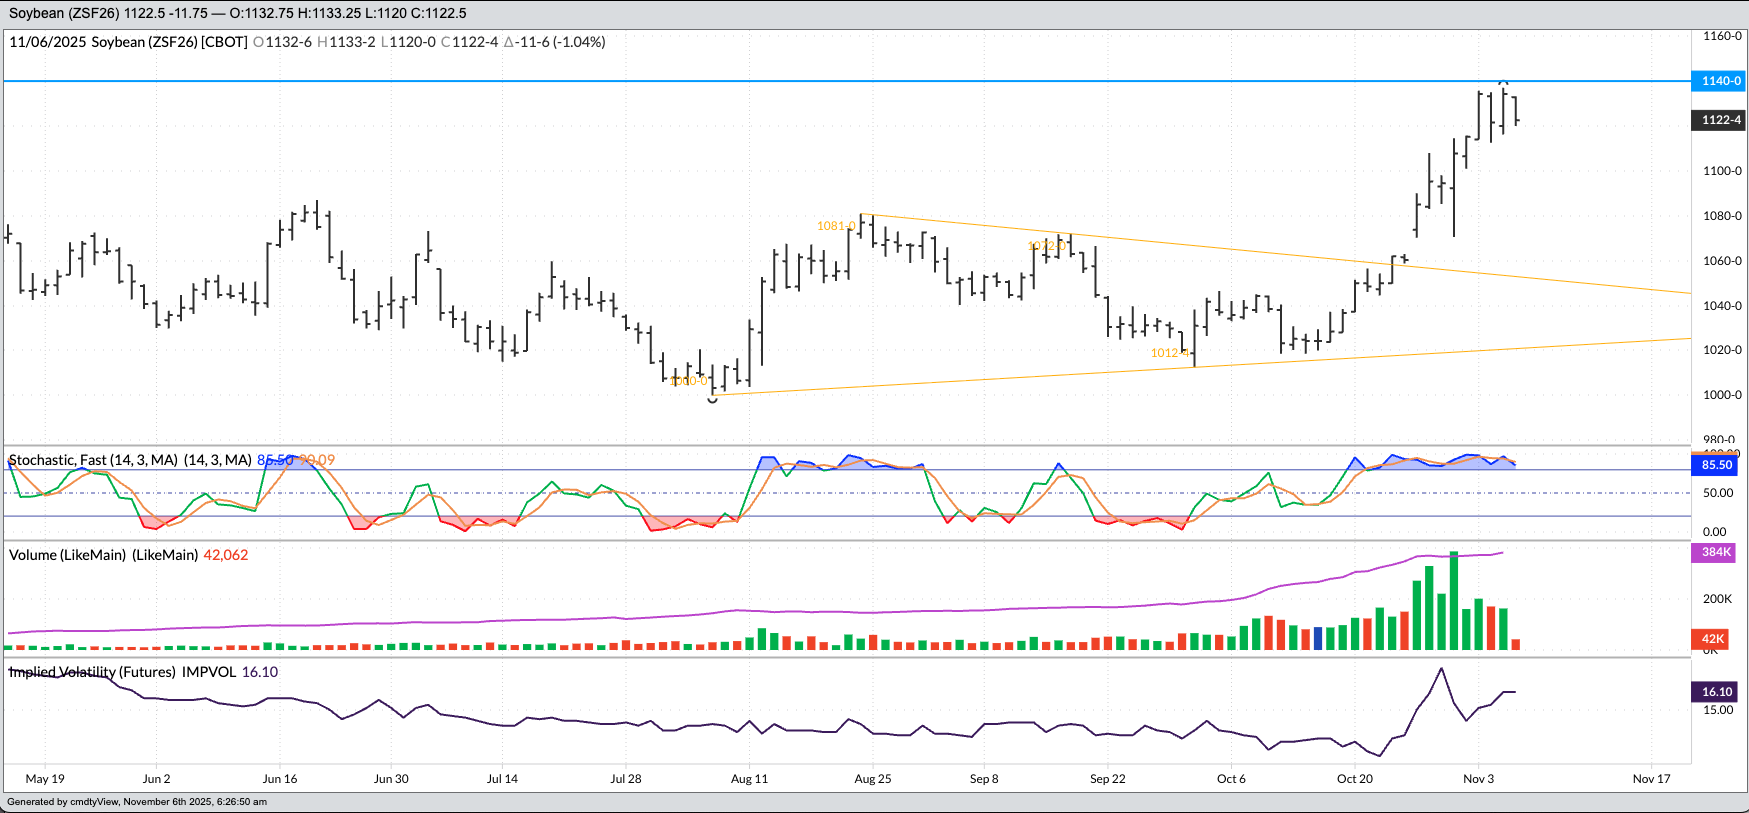
From a technical point of view, I took another look at the daily chart for the January futures contract (ZSF26) given what has happened so far this week. Toward the end of October, the January issue broke out of its sideways trend – what looked to be a wedge pattern created by converging trend lines – on buying from both noncommercial and commercial traders.
The wedge had a base of 81.0 cents, from the low of $10.00 (August 6) to the high of $10.81 (August 22). The high-end trend line was created by connecting the next high of $10.72 on September 17, a decrease of 9.0 cents over 17 cents trading cents or roughly 0.5 cent per day. Extending this trend line through October and we see Jan soybeans broke out on October 23 with a move above $10.59, hitting a high of $10.6225 that day before closing at $10.62.
This put the upside target near $11.40 by adding the original base (81.0 cents) to the breakout price ($10.59).
- This week has seen Jan hit a high of $11.37 on Wednesday, October 5
- before falling back to a low of $11.20 overnight through early Thursday morning
- Also note daily stochastics are above 90% indicating the contract is sharply overbought, but that and $5 will get you a cup of coffee from the local barista.
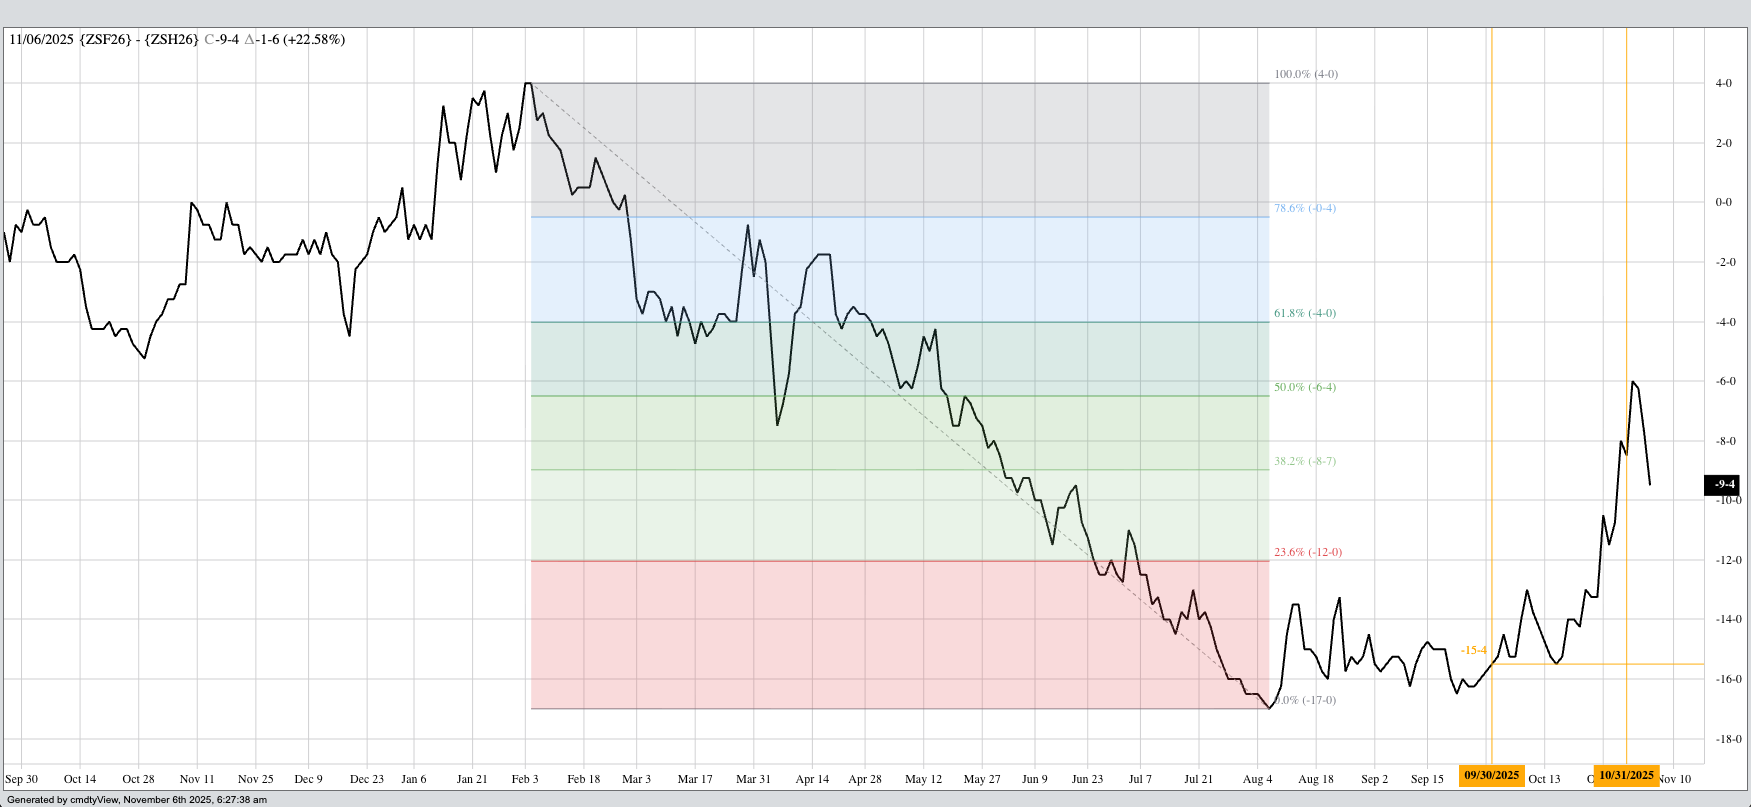
While there is a lot of downside to the US government shutdown that went into effect on October 1, there have been some slivers of silver lining as well. First and foremost, the quiet on USDA report days has been nice, forcing others in the industry to either find something else to do or focus on real market fundamental reads – cash price, basis, and futures spreads. Using these, we can see the other silver lining in the soybean market: China has used the lack of government reporting to cover some of its secondary needs. Let’s look at the daily chart for the January-March futures spread.
At the end of September, the spread sat at a carry of 15.5 cents (and covered 60% calculated full commercial carry), off its low daily close of 17.0 cents carry (66%) on August 6. However, since the lights went out in D.C. (not quite as catchy a tune as “Georgia”), the Jan-March spread has seen its carry cut to:
- 8.5 cents (31.5%) at the close of business on Friday, October 31
- 6.0 cents (22%) the following Monday, November 3
What does this tell us? Sales of US soybean supplies have increased while post-harvest (for the most part) available supplies of US soybeans have stabilized. The bulk of newly harvested bushels that will be sold within the harvest time frame have been sold. Is this extraordinary, or out of the norm for the US market? No. Recall the US sells and ships roughly 75% of its marketing year total by the end of February, the midpoint of the marketing year, before being replaced by in the market by new Brazilian supplies.
Overnight through early Thursday morning we see the carry has firmed to 9.25 cents (34%) as the January issue dropped as much as 14.25 cents overnight on trade volume of 33,500 contracts. My Blink reaction is commercials were selling Wednesday’s noncommercial led rally, but let’s see how the rest of the day plays out.
[i] Taking a trip out to the Barn to revisit Wednesday’s carnage, both cattle markets were limit down – again – raising these marks to $13.75 in feeders and $10.75 in live. Normally I would add it is unlikely these expanded limits will come into play today, but anything is possible when the only certainty is uncertainty.
On the date of publication, Darin Newsom did not have (either directly or indirectly) positions in any of the securities mentioned in this article. All information and data in this article is solely for informational purposes. For more information please view the Barchart Disclosure Policy here.


