• Image 01
  • Image 02
  • Image 03
  • Image 04
  • Image 05
  • Image 06
Need assistance? Contact Us: 1-800-255-5897

Menu

  • Home
  • About Us
    • Company Overview
    • Management Team
    • Board of Directors
  • Your Loan Service Center
  • MAKE A PAYMENT
  • Business Service Center
  • Contact Us
  • Home
  • About Us
    • Company Overview
    • Management Team
    • Board of Directors
  • Your Loan Service Center
  • MAKE A PAYMENT
  • Business Service Center
  • Contact Us
Recent Quotes
View Full List
My Watchlist
Create Watchlist
Indicators
DJI
Nasdaq Composite
SPX
Gold
Crude Oil
Markets
Stocks
ETFs
Tools
Markets:
Overview
News
Currencies
International
Treasuries

How Is APA's Stock Performance Compared to Other Oil & Gas Stocks?

By: Barchart.com
December 16, 2025 at 03:12 AM EST

Houston, Texas-based APA Corporation (APA) operates as an independent energy company. It explores, develops, and produces natural gas, crude oil, and natural gas liquids. With a market cap of $9.2 billion, APA’s oil and gas operations span the United States, Egypt, the North Sea, and Suriname.

Companies worth between $2 billion and $10 billion are generally described as "mid-cap stocks." APA fits right into that category, with its market cap exceeding this threshold, reflecting its substantial size and influence in the oil & gas exploration & production industry.

More Top Stocks Daily: Go behind Wall Street’s hottest headlines with Barchart’s Active Investor newsletter.


APA touched its 52-week high of $27.72 on Dec. 5 and is currently trading 8.8% below that peak. Meanwhile, APA’s stock prices have surged 10.3% over the past three months, significantly outperforming the iShares U.S. Oil & Gas Exploration & Production ETF’s (IEO) 2.2% uptick during the same time frame.

www.barchart.com

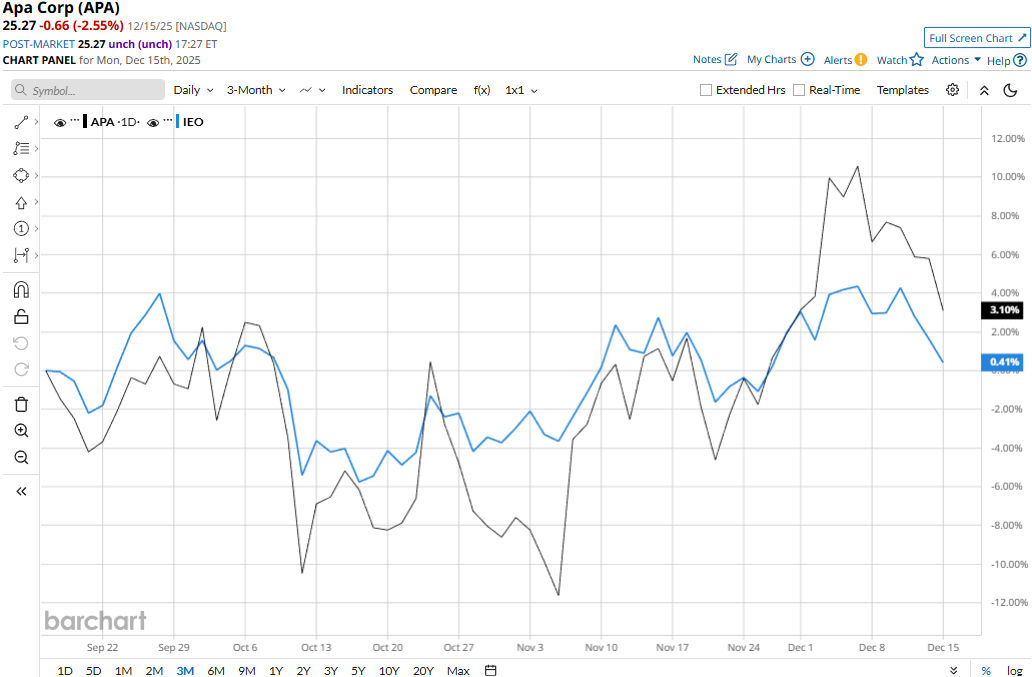
APA has outperformed over the longer term as well. APA’s stock prices have surged 9.4% on a YTD basis and 10.5% over the past 52 weeks, significantly outpacing IEO’s 3.2% uptick in 2025 and marginal 10 bps dip over the past year.

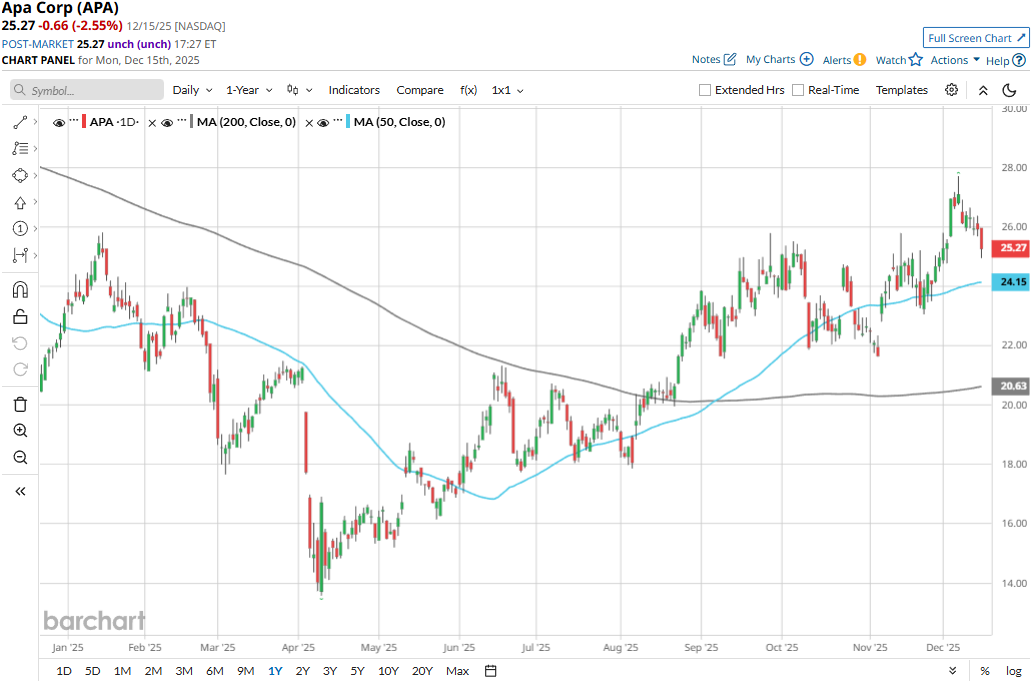
APA has traded consistently above its 200-day moving average since mid-August and mostly above its 50-day moving average since June, with some fluctuations, underscoring its bullish trend.

www.barchart.com

APA’s stock prices soared 9.1% in a single trading session following the release of its mixed Q3 results on Nov. 5. Due to a significant drop in oil prices compared to the year-ago quarter, the company’s oil revenues for the quarter dropped 18.2% year-over-year to $1.5 billion. However, the company’s natural gas revenues observed a notable uptick. Overall, APA’s revenues for the quarter declined 16.4% year-over-year to $2.1 billion, missing the Street’s expectations by a small margin.

However, APA’s margins observed a notable improvement, leading to a much more modest 7% decline in adjusted EPS to $0.93, surpassing the consensus estimates by a staggering 25.7%.

However, when compared to its peer, Marathon Oil Corporation (MRO) has soared 18.2% in 2025 and 12.8% over the past year, outperforming APA by a large margin.

Among the 30 analysts covering the APA stock, the consensus rating is a “Hold.” As of writing, the stock is trading slightly below its mean price target of $25.93.


On the date of publication, Aditya Sarawgi did not have (either directly or indirectly) positions in any of the securities mentioned in this article. All information and data in this article is solely for informational purposes. For more information please view the Barchart Disclosure Policy here.


More news from Barchart

  • Should You Buy Monolithic Power Stock Before Dec. 22?
  • 4 Quotable Investing Lessons in Honor of the Late Rob Reiner
  • Should You Buy the Dip in Oracle Stock and Hold for 2026?
  • Can Nextdoor Stock Hit $4 Before the End of 2025?

More News

View More
News headline image
Rocket Lab's Sharp Rebound: What's Behind the Recent Momentum ↗
Today 9:02 EST
Via MarketBeat
Tickers RKLB
News headline image
Jabil Is Flying Under the Radar—But a 50% Surge May Be Coming ↗
Today 8:18 EST
Via MarketBeat
Tickers AAPL AMZN AVGO CSCO JBL
News headline image
Qualcomm’s Monster Rally Has a Catch—Can the Stock Keep Climbing? ↗
Today 7:08 EST
Via MarketBeat
Tickers NVDA QCOM
News headline image
Broadcom Stock Crashes 20%—But Wall Street Sees It Soaring to $500 ↗
December 18, 2025
Via MarketBeat
Tickers AVGO NVDA ORCL SOXX
News headline image
Forget the Chips: 4 Industrial Plays for the AI Rebound ↗
December 18, 2025
Via MarketBeat
Topics Artificial Intelligence
Tickers AVGO ETN JCI ORCL SMR XYL

Recent Quotes

View More
Symbol Price Change (%)
AMZN  225.97
-0.79 (-0.35%)
AAPL  271.94
-0.25 (-0.09%)
AMD  206.00
+4.94 (2.46%)
BAC  54.85
+0.59 (1.09%)
GOOG  302.80
-0.95 (-0.31%)
META  661.97
-2.48 (-0.37%)
MSFT  483.93
-0.06 (-0.01%)
NVDA  177.84
+3.70 (2.13%)
ORCL  190.72
+10.69 (5.94%)
TSLA  484.81
+1.44 (0.30%)
Stock Quote API & Stock News API supplied by www.cloudquote.io
Quotes delayed at least 20 minutes.
By accessing this page, you agree to the Privacy Policy and Terms Of Service.
© 2025 FinancialContent. All rights reserved.

Having difficulty making your payments? We're here to help! Call 1-800-255-5897

Copyright © 2019 Franklin Credit Management Corporation
All Rights Reserved
Contact Us | Privacy Policy | Terms of Use | Sitemap