• Image 01
  • Image 02
  • Image 03
  • Image 04
  • Image 05
  • Image 06
Need assistance? Contact Us: 1-800-255-5897

Menu

  • Home
  • About Us
    • Company Overview
    • Management Team
    • Board of Directors
  • Your Loan Service Center
  • MAKE A PAYMENT
  • Business Service Center
  • Contact Us
  • Home
  • About Us
    • Company Overview
    • Management Team
    • Board of Directors
  • Your Loan Service Center
  • MAKE A PAYMENT
  • Business Service Center
  • Contact Us
Recent Quotes
View Full List
My Watchlist
SunTrust Banks
Edit Watchlist
Indicators
Dow Jones Industrial Average
NASDAQ Composite
Standard & Poors 500
Gold
Crude Oil
Markets
Stocks
ETFs
Tools
Markets:
Overview
News
Currencies
International
Treasuries

CME Group (NQ:CME)

307.56 +1.25 (+0.41%)
Delayed Quote Updated: 4:00 PM EST, Nov 20, 2026 Add to My Watchlist
Quote
Overview Detailed Quote Charting Historical Prices
News
All News News Headlines Press Releases
Research
Quarterly Reports Insider Filings Other Filings

Price and Volume

Detailed Quote
Volume 2,678,248
Open 310.48
Bid (Size) 307.90 (40)
Ask (Size) 313.00 (160)
Prev. Close 306.31
Today's Range 306.88 - 313.10
52wk Range 218.31 - 329.16
Shares Outstanding 358,888
Dividend Yield 1.69%
Chart for  (: )
Intraday 1 Week 1 Month 3 Month 1 Year 3 Year 5 Year

Top News

More News
News headline image
CME vs. Robinhood Markets: Which Financial Stock Is a Better Buy for 2027? ↗
November 21, 2026
Robinhood's revenue grew far faster than CME's over the latest 12 months, yet its debt load tells a very different story about financial risk. 
Via The Motley Fool
Topics Artificial Intelligence Derivatives
News headline image
CME vs. Upstart: Which Financial Stock Is a Better Buy for 2027? ↗
November 18, 2026
CME's roughly $4 billion profit and near-zero leverage stand in contrast to Upstart's 64% revenue surge, but the lending specialist's leverage and negative free cash flow tell a different story. 
Via The Motley Fool
Topics Artificial Intelligence Derivatives

Performance

52-Week Range 6.6% below 52-week high
307.56
218.3152W Low 329.1652W High
1 Week 4.3% below 1-week high
305.121W Low 321.391W High

CME Group (CME) traded between $218.31 and $329.16 over the past 52 weeks and last traded at $307.56, 6.6% below its 52-week high. Over the past week it ranged between $305.12 and $321.39.

Past 12 Months
-3.7%
+0.5%
+10.2%
+8.9%
+14.0%
+12.6%
1W -$11.81
1M +$1.58
3M +$28.39
6M +$25.02
YTD +$37.88
1Y +$34.47

CME was +12.6% over the past year, +8.9% over six months, +14.0% year to date, -3.7% in the last week.

12 Months vs Market
CME
+12.6%
DIA
+4.0%
SPY
+4.7%
QQQ
+3.1%
IWM
+8.9%

Over the past 12 months CME returned +12.6% versus DIA (Dow) +4.0%, SPY (S&P 500) +4.7%, QQQ (Nasdaq 100) +3.1% and IWM (Russell 2000) +8.9%.

Volume & Liquidity 1.37× 3-mo avg
Today 2,678,248 3-mo avg 2.0M
1W
2.2M
1M
1.9M
3M
2.0M
6M
2.6M
YTD
2.5M
1Y
2.4M

CME most recently traded 2,678,248 shares against a 3-month average daily volume of 2.0M.

More News

Read More

News headline image
CME vs. Toast: Which Financial Stock Is a Better Buy for 2027? ↗
November 17, 2026

Via The Motley Fool
Topics Derivatives
News headline image
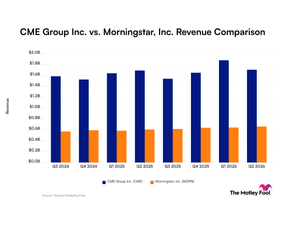
CME vs. Morningstar: Which Financial Stock Is a Better Buy for 2027? ↗
November 16, 2026

Via The Motley Fool
Topics Derivatives Retirement
News headline image
3 Dividend Stocks Built for a Market Priced Like It's 1999 ↗
November 13, 2026

Via The Motley Fool
Topics Artificial Intelligence
News headline image
Prediction: This Under-the-Radar Artificial Intelligence (AI) Stock Is Going to Double Over the Next 12 Months ↗
November 10, 2026
Via The Motley Fool
Topics Artificial Intelligence
News headline image
CME vs. PayPal: Which Financial Stock Is a Better Buy for 2027? ↗
November 10, 2026

Via The Motley Fool
Topics Derivatives
News headline image
CME vs. S&P Global: Which Financial Stock Is a Better Buy for 2027? ↗
November 10, 2026

Via The Motley Fool
Topics Derivatives Stocks
News headline image
Markets Are Pricing in a Fed Rate Hike in December. Here's What Investors Should Do, According to History. ↗
November 08, 2026
Via The Motley Fool
Topics Bonds ETFs Economy
S&P 500 After-Hours Movers: ABNB and SNDK Gain, AXON and SOLV Fall ↗
November 05, 2026

Via Chartmill
Topics Stocks
News headline image
Prediction: A Stock Market Crash Is Coming. Here's What Investors Should Do Based on Nearly 70 Years' Worth of History. ↗
November 05, 2026
Via The Motley Fool
Topics Artificial Intelligence Economy Energy
News headline image
CME vs. Nu: Which Financial Stock Is a Better Buy for 2027? ↗
November 04, 2026

Via The Motley Fool
Topics Credit Cards
News headline image
CME vs. Interactive Brokers Group: Which Financial Stock Is a Better Buy for 2027? ↗
November 03, 2026
Via The Motley Fool
Topics Derivatives
News headline image
CME Group's Market Data Revenue Hit a Record $243 Million Last Quarter. Can It Carry the Stock When Trading Slows? ↗
November 03, 2026
Via The Motley Fool
News headline image
1 momentum stock with exciting potential and 2 we avoid
November 02, 2026

Via StockStory
Topics Derivatives
News headline image
CME vs. SoFi Technologies: Which Financial Stock Is a Better Buy for 2027? ↗
November 02, 2026
Via The Motley Fool
Topics Derivatives
News headline image
CME vs. Morningstar: Scale vs. Consistent Trajectories in Revenue ↗
October 30, 2026

Via The Motley Fool
News headline image
CME vs. Mastercard: Which Financial Stock Is a Better Buy in 2026? ↗
October 27, 2026

Via The Motley Fool
Topics Derivatives Economy
News headline image
3 unpopular stocks with questionable fundamentals
October 27, 2026

Via StockStory
Topics Derivatives
News headline image
Here's Exactly What Investors Should Look for From the Federal Reserve's October Meeting ↗
October 26, 2026
Via The Motley Fool
Topics Bonds Economy
News headline image
Q3 Earnings: Review Quarterly, Manage Accordingly ↗
October 26, 2026
Via The Motley Fool
Topics Artificial Intelligence Derivatives
News headline image
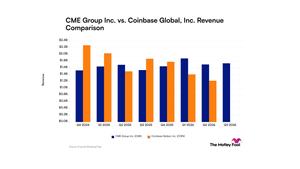
CME Group vs. Coinbase Global: Steady Growth Meets Crypto's Boom-and-Bust Cycle ↗
October 26, 2026
Via The Motley Fool
Topics Derivatives
News headline image
The Latest Inflation Data Spells Bad News for Fed Chair Kevin Warsh and the Stock Market ↗
October 22, 2026
Via The Motley Fool
Topics Economy
News headline image
CME Q3 deep dive: diversified volume growth and product innovation underpin results
October 22, 2026
Via StockStory
Topics Derivatives Economy
News headline image
CME Group: 3 Key Takeaways for Long-Term Investors ↗
October 21, 2026
Via The Motley Fool
Topics Derivatives Earnings Economy

Frequently Asked Questions

Is CME Group publicly traded?
Yes, CME Group is publicly traded.
What exchange does CME Group trade on?
CME Group trades on the Nasdaq Stock Market
What is the ticker symbol for CME Group?
The ticker symbol for CME Group is CME on the Nasdaq Stock Market
What is the current price of CME Group?
The current price of CME Group is 307.56
When was CME Group last traded?
The last trade of CME Group was at 11/20/26 04:00 PM ET
What is the market capitalization of CME Group?
The market capitalization of CME Group is 110.38M
How many shares of CME Group are outstanding?
CME Group has 110M shares outstanding.
Stock Quote API & Stock News API supplied by www.cloudquote.io
Quotes delayed at least 20 minutes.
By accessing this page, you agree to the Privacy Policy and Terms Of Service.
© 2025 FinancialContent. All rights reserved.

Having difficulty making your payments? We're here to help! Call 1-800-255-5897

Copyright © 2019 Franklin Credit Management Corporation
All Rights Reserved
Contact Us | Privacy Policy | Terms of Use | Sitemap