The plant-based pioneer, Beyond Meat (BYND), stormed onto the Nasdaq Composite ($NASX) in 2019, sizzling with ambition and wrapped in all the promise of a greener, guilt-free future. Investors were hooked, knives and forks ready, eager to take a bite out of the future of food. But oh, how quickly appetites change.
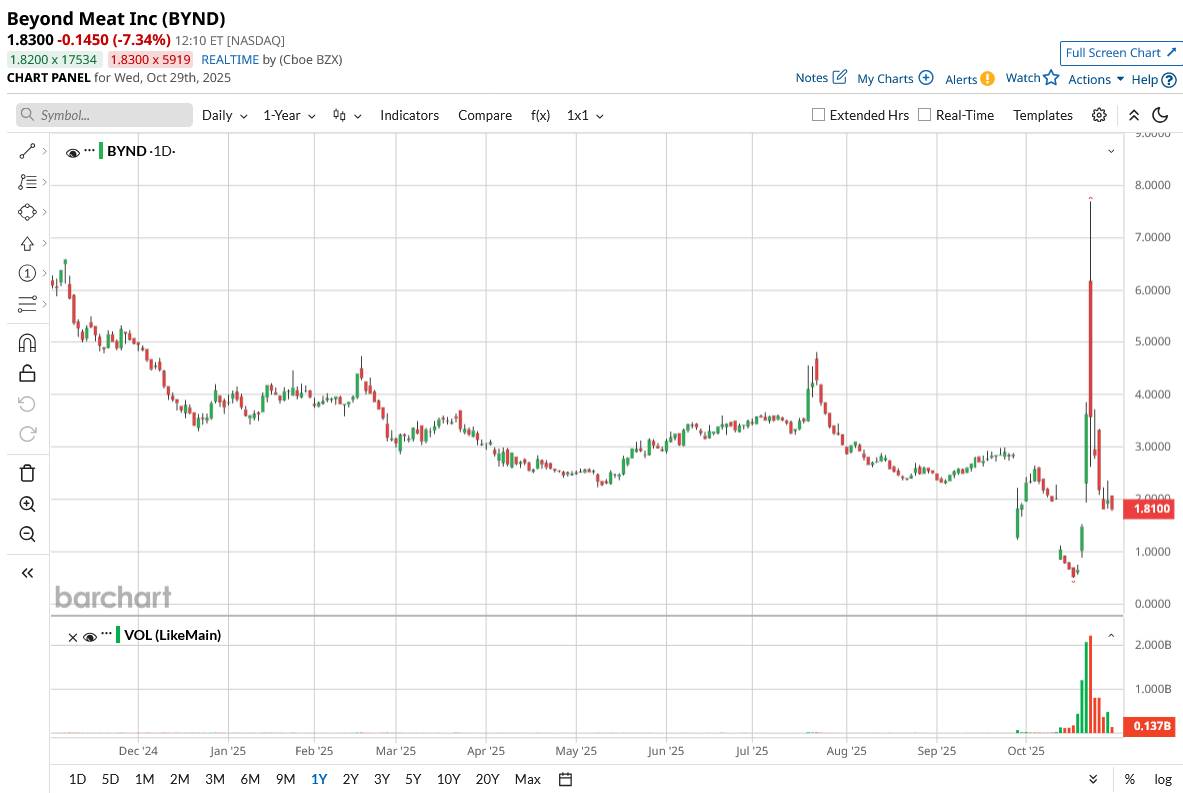
The same crowd that once cheered for its juicy vision now seems to be pushing the plate away. After a meme-fueled rally drove shares up 238.4% last week, the party lights dimmed abruptly. The stock has now fallen for four straight days, with only a short reprieve yesterday before starting downwards again today. Taken together, BYND has lost a whopping 49% in the last five days of trading.
This all unfolds as Beyond Meat gears up to serve its Q3 2025 financials on Tuesday, Nov. 4, after the market close. Early whispers from the kitchen are not too appetizing.
The company expects third-quarter revenue to decline by another 13% year-over-year (YoY) to $70 million, within its forecasted range of $68 million to $73 million, but still well below the $81 million plated last year. Analysts’ consensus sits at $68.83 million, showing no surprise in sight.
Gross margin is projected to be between 10% and 11%, a sharp dip from 17.7% last year. Operating expenses, however, are expected to ease slightly to a range of $41 million to $43 million compared to $45.2 million in the third quarter of 2024.
And the kicker is that Beyond Meat is bracing for a “material” impairment charge on its long-term assets, though the exact bite size of that hit is still unknown. Now, all eyes turn to Nov. 4, when the company faces the market’s judgment once again.
About Beyond Meat Stock
Beyond Meat, based in El Segundo, California, crafts plant-based meat alternatives that aim to look, cook, and taste like the real thing. Using a blend of pea protein, coconut oil, and beet juice extract, the company has developed an entire product line that includes burgers, sausages, and meatballs.
But the story on Wall Street tells a different flavor profile. With a market cap now down to nearly $167.7 million, Beyond Meat’s shine has dulled under the weight of falling sales, tightening margins, and consumer fatigue.
Over the past 52 weeks, BYND shares have tumbled 71.1%. Even in the last three months, they have slipped another 44.3%. The recent meme-fueled rally could not hold the heat either. Despite touching a fresh 52-week high of $7.69 on Oct. 22, the stock is still down 0.27% for the month.
Currently, BYND trades at 2.2 times sales, a hefty premium compared to its industry peers. Investors might wonder whether that premium still makes sense, especially when the sizzle seems to be fading faster than the steak.
A Closer Look at Beyond Meat’s Q2 Earnings
When Beyond Meat served up its Q2 2025 results on Aug. 8, the numbers left investors with a bitter aftertaste. Revenue fell 19.6% YoY to $75 million, missing Wall Street’s $83.75 million estimate. The culprit was the continued weakness in the plant-based meat category, especially in the U.S. retail sector and select international foodservice markets.
The company managed to narrow its net loss to $29.2 million, though, a 15.2% improvement from the prior year. Loss per share came in at $0.38, tightening 28.3% from a year ago.
Adjusted EBITDA slipped 3.7% to $22.1 million, signaling that profitability remains as elusive as ever. Beyond Meat insists it is still cooking up a turnaround. The company is targeting positive EBITDA by 2026. Cost-cutting measures such as workforce reductions, leaner operations, and a stronger focus on in-house manufacturing are already on the way.
That said, analysts are penciling in a loss per share of $0.41 for Q3 fiscal 2025, but there is a faint light flickering at the end of the tunnel. For the full year, that loss is projected to narrow by 17.3% to $1.91 per share, with 2026 expected to bring a further 8.9% improvement to $1.74. The figures indicate improvement, but the pace is slow rather than fast.
What Do Analysts Expect for BYND Stock?
Wall Street analysts are not exactly raising a toast. TD Cowen’s senior analyst Robert Moskow has doubled down on his “Sell” rating and cut the price target again, from $2 to just $0.80. Mizuho analyst John Baumgartner shares a similar sentiment. He lowered his price target to $1.50 from $2, reiterating an “Underperform” rating.
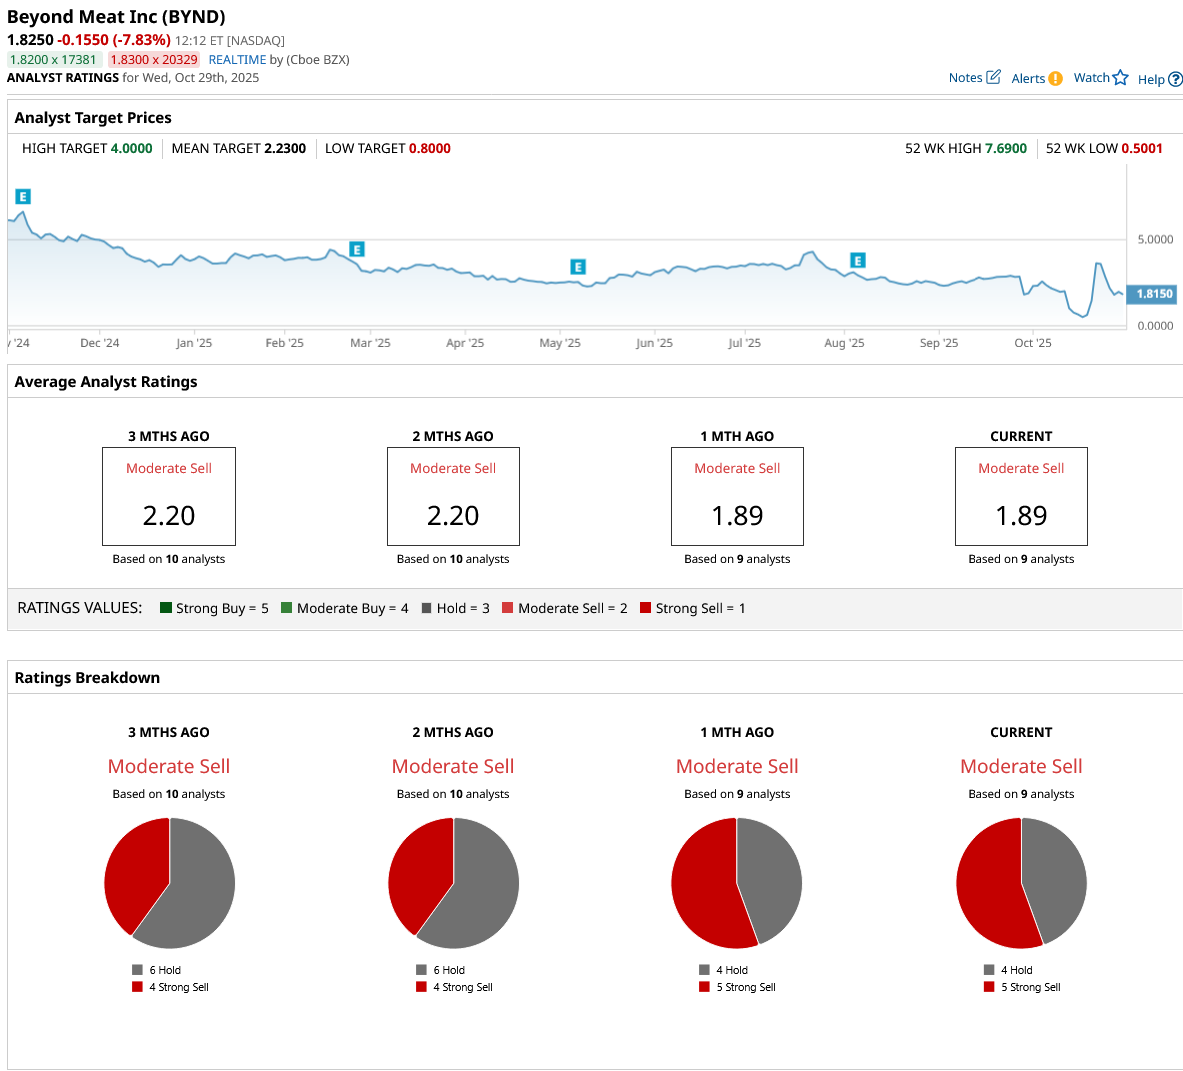
The consensus rating on BYND stock currently sits at “Moderate Sell.” Out of nine analysts covering BYND, four recommend “Hold,” while five say “Strong Sell.” The average price target stands at $2.33, hinting at a 28% upside from current levels. The Street-high target, at $4, suggests a potential gain of 119% from current levels.
Meanwhile, the Street-Low target at $0.80 reflects the potential fall could be 56% if the company fails to turn things around.
On the date of publication, Aanchal Sugandh did not have (either directly or indirectly) positions in any of the securities mentioned in this article. All information and data in this article is solely for informational purposes. For more information please view the Barchart Disclosure Policy here.
More news from Barchart