ETFOptimize | High-performance ETF-based Investment Strategies

Quantitative strategies, Wall Street-caliber research, and insightful market analysis since 1998.


ETFOptimize | HOME
Close Window

JPMorgan Chase Stock: Analyst Estimates & Ratings

JPMorgan Chase & Co. (JPM) provides financial and retail banking services. Valued at $850.9 billion by market cap, the company provides services such as investment banking, treasury and securities, asset management, private banking, card member, commercial banking, and home finance. 

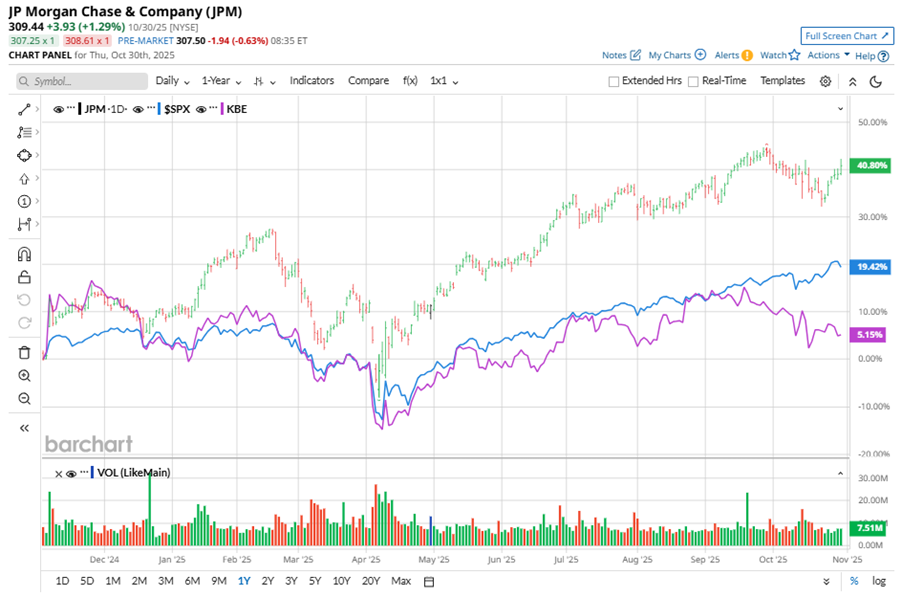
Shares of this investment banking leader have outperformed the broader market over the past year. JPM has gained 37.9% over this time frame, while the broader S&P 500 Index ($SPX) has rallied nearly 17.4%. In 2025, JPM’s stock rose 29.1%, surpassing the SPX’s 16% rise on a YTD basis. 


Zooming in further, JPM’s outperformance looks more pronounced compared to the SPDR S&P Bank ETF (KBE). The exchange-traded fund has gained about 2% over the past year. Moreover, JPM’s double-digit gains on a YTD basis outshine the ETF’s 2% returns over the same time frame.

www.barchart.com

JPMorgan's stellar performance was driven by robust growth across its business segments. Net interest income rose 2% to $24.1 billion, while investment banking fees jumped 16%. The Markets segment notched its best Q3 ever with $8.9 billion in revenue, and Asset & Wealth Management reached a record $6.1 billion, up 11.5%.

On Oct. 14, JPM shares closed down by 1.9% after reporting its Q3 results. Its net revenue stood at $46.4 billion, up 8.8% year over year. The company’s EPS increased 16% from the prior-year quarter to $5.07. 

For the current fiscal year, ending in December, analysts expect JPM’s EPS to grow 9.4% to $19.92 on a diluted basis. The company’s earnings surprise history is impressive. It beat the consensus estimate in each of the last four quarters.

Among the 28 analysts covering JPM stock, the consensus is a “Moderate Buy.” That’s based on 15 “Strong Buy” ratings, three “Moderate Buys,” nine “Holds,” and one “Strong Sell.”

www.barchart.com

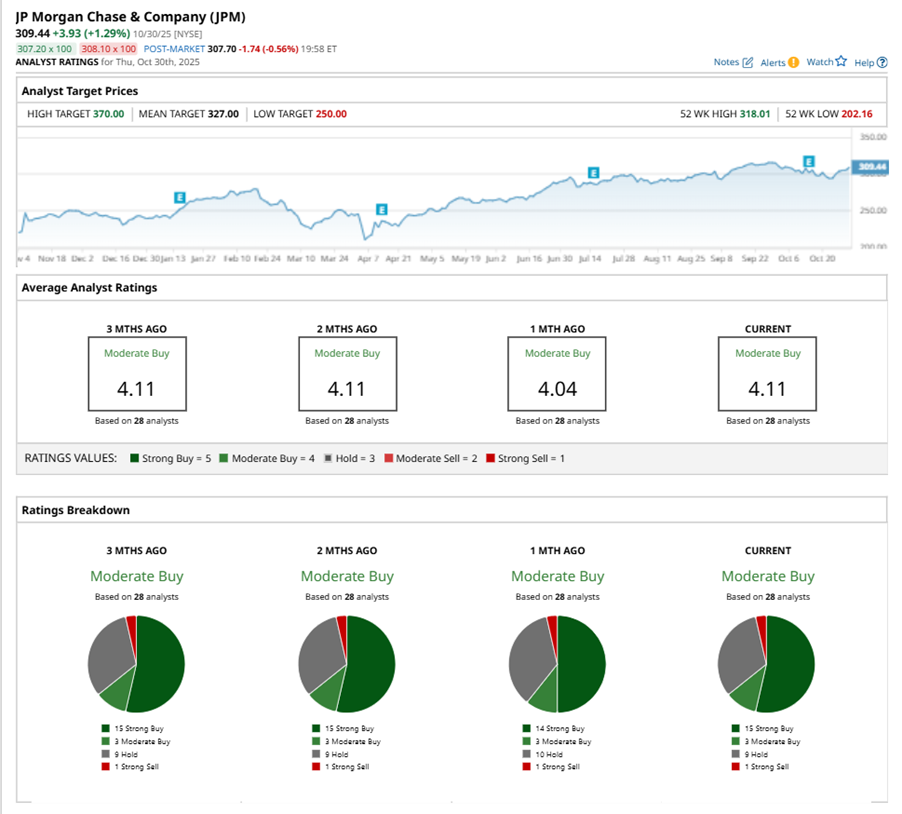
This configuration is more bullish than a month ago, with 14 analysts suggesting a “Strong Buy.”

On Oct. 15, Morgan Stanley (MS) kept an “Equal Weight” rating on JPM and raised the price target to $338, implying a potential upside of 9.2% from current levels.

The mean price target of $327 represents a 5.7% premium to JPM’s current price levels. The Street-high price target of $370 suggests an upside potential of 19.6%. 


On the date of publication, Neha Panjwani did not have (either directly or indirectly) positions in any of the securities mentioned in this article. All information and data in this article is solely for informational purposes. For more information please view the Barchart Disclosure Policy here.


More news from Barchart

Recent Quotes

View More
Symbol Price Change (%)
AMZN  244.22
+21.36 (9.58%)
AAPL  270.37
-1.03 (-0.38%)
AMD  256.12
+1.28 (0.50%)
BAC  53.45
+0.42 (0.79%)
GOOG  281.82
-0.08 (-0.03%)
META  648.35
-18.12 (-2.72%)
MSFT  517.81
-7.95 (-1.51%)
NVDA  202.49
-0.40 (-0.20%)
ORCL  262.61
+5.72 (2.23%)
TSLA  456.56
+16.46 (3.74%)
Stock Quote API & Stock News API supplied by www.cloudquote.io
Quotes delayed at least 20 minutes.
By accessing this page, you agree to the Privacy Policy and Terms Of Service.


IntelligentValue Home
Close Window

DISCLAIMER

All content herein is issued solely for informational purposes and is not to be construed as an offer to sell or the solicitation of an offer to buy, nor should it be interpreted as a recommendation to buy, hold or sell (short or otherwise) any security.  All opinions, analyses, and information included herein are based on sources believed to be reliable, but no representation or warranty of any kind, expressed or implied, is made including but not limited to any representation or warranty concerning accuracy, completeness, correctness, timeliness or appropriateness. We undertake no obligation to update such opinions, analysis or information. You should independently verify all information contained on this website. Some information is based on analysis of past performance or hypothetical performance results, which have inherent limitations. We make no representation that any particular equity or strategy will or is likely to achieve profits or losses similar to those shown. Shareholders, employees, writers, contractors, and affiliates associated with ETFOptimize.com may have ownership positions in the securities that are mentioned. If you are not sure if ETFs, algorithmic investing, or a particular investment is right for you, you are urged to consult with a Registered Investment Advisor (RIA). Neither this website nor anyone associated with producing its content are Registered Investment Advisors, and no attempt is made herein to substitute for personalized, professional investment advice. Neither ETFOptimize.com, Global Alpha Investments, Inc., nor its employees, service providers, associates, or affiliates are responsible for any investment losses you may incur as a result of using the information provided herein. Remember that past investment returns may not be indicative of future returns.

Copyright © 1998-2017 ETFOptimize.com, a publication of Optimized Investments, Inc. All rights reserved.